Adding Visualizations to Your Gallery
The Thinkspace includes an optional feature that lets you create a visualization in the Thinkspace and then add it as a new panel in an existing Logi Dashboard in another report, or add it to a Visual Gallery.

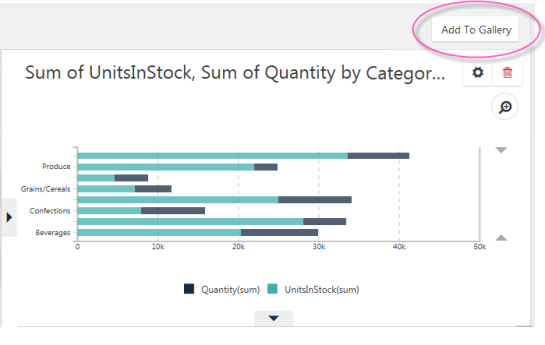
If your application has been configured for this feature, the Thinkspace will display a button like the one shown above. It may say "Add to Gallery" or "Add to Dashboard" or something similar, depending on how the application was configured.

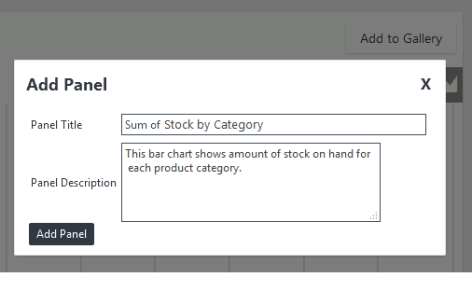
Just before the visualization is saved, you'll be prompted for the Panel Title and an optional description for display. These will appear in the Visual Gallery next to a small thumbnail image of the visualization.

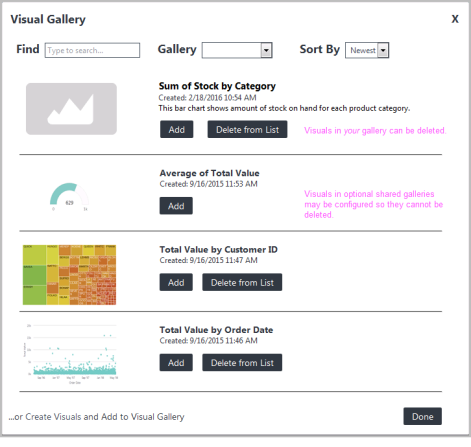
The new visualization thereafter appears in the Visual Gallery, as shown above, just like any other resource, with a special icon. Visualizations created with other analysis tools include a thumbnail image. Visualizations can be removed from your gallery entirely, using the available
controls.