Thinkspace - Setting Color Thresholds
You can set another type of in-cell graphic by coloring column cells based on data value thresholds. Click Colors on a column's gear menu:
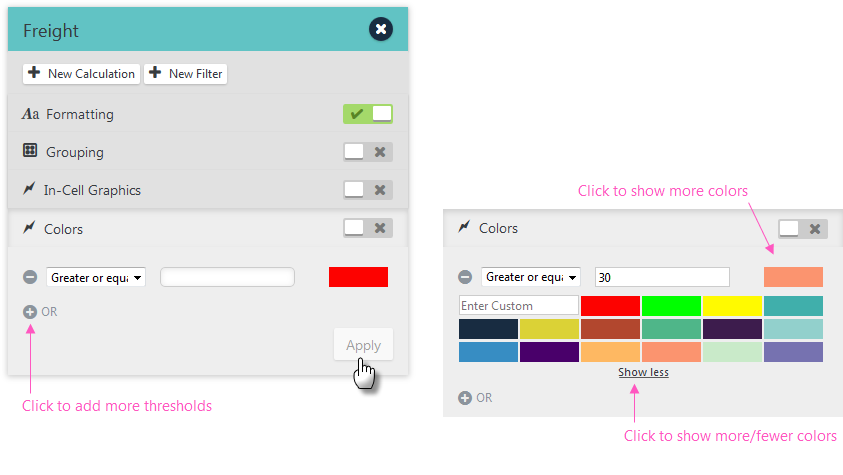
Using the Colors controls, select a comparison operator, enter a comparison value, and select a color, as shown above.
Click the color swatch to show more colors and the Show more link to show additional colors. You can also enter color values directly as hex ("#CCCCCC"), RGB ("rgb(197, 95, 169)"), or text ("Blue") values.
Click the ![]() icons to add or remove thresholds. Click Apply to immediately apply the thresholds.
icons to add or remove thresholds. Click Apply to immediately apply the thresholds.
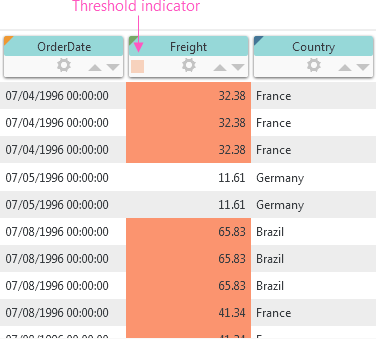
The resulting chart, with just one threshold defined, will look similar to the one shown above. Note that the column pill has a colored threshold indicator displayed now.