Thinkspace - Creating a Timeline Chart
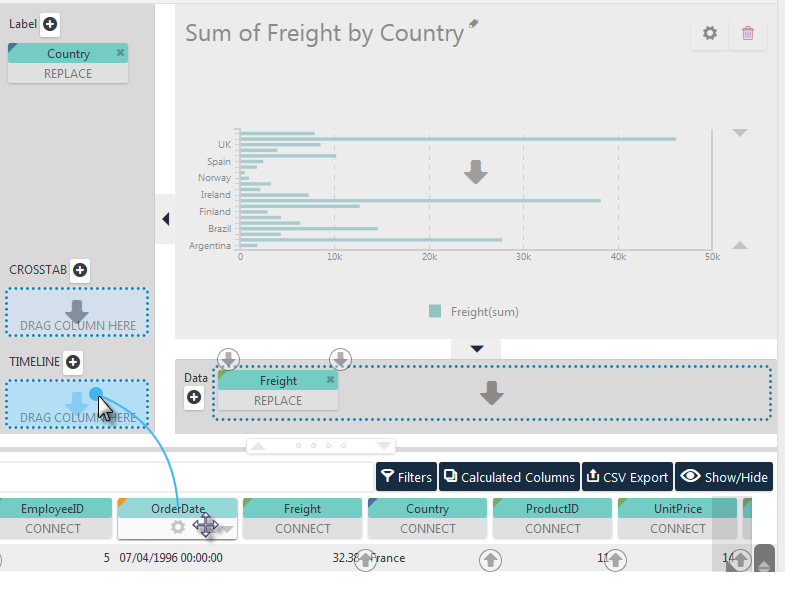
A Timeline chart shows you how data has changed over time. In order to create a Timeline chart in the Thinkspace, first create a chart as usual:

Then drag-and-drop the pill for a temporal (DateTime) column into the TIMELINE drop zone, as shown above. You can use the "+" icon to a select column from a list instead of dragging if you prefer.

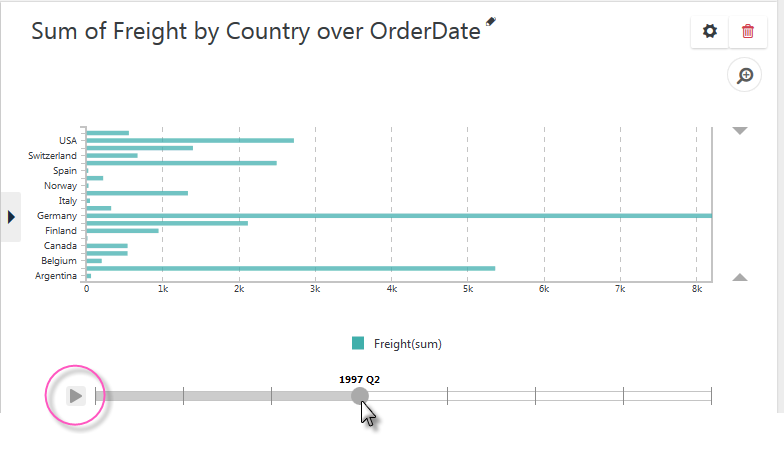
The animation controls will appear below the chart; these control the presentation of the chart data over time. Click the "Play" icon, circled above, to start/stop sequencing the data. You can also drag the playback point forwards and backwards with your mouse cursor.