Thinkspace - Creating a Combo Chart
A Combo chart allows you combine several chart types, overlaying them, for easier comparison of the data.
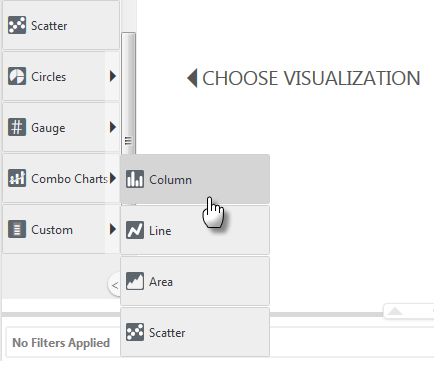
In order to create a Combo chart in the Thinkspace, scroll down in the Visualization menu and select Combo Charts![]() (base chart type of your choice).
(base chart type of your choice).
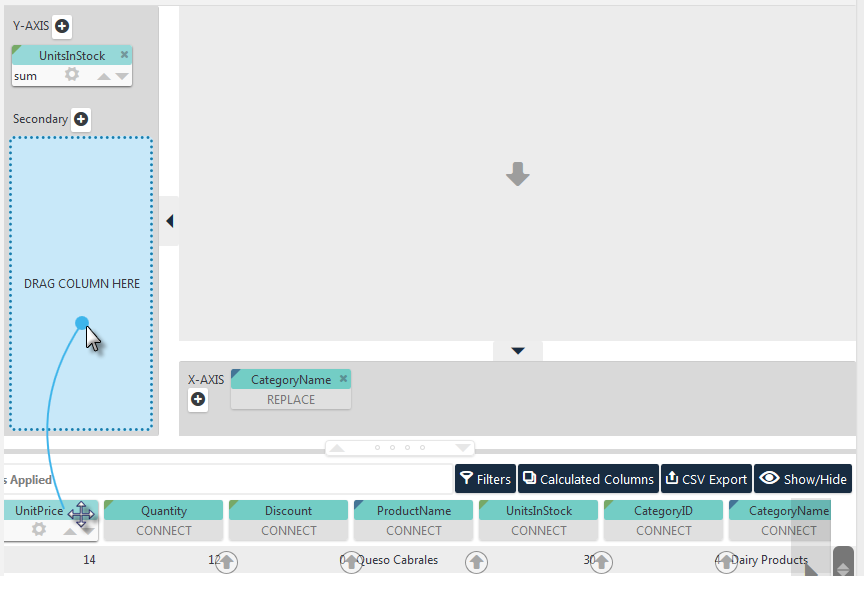
Drag-and-drop the data pills necessary to create the first chart series (in the example above CategoryName and UnitsInStock). Then drag the pill for your second series (UnitPrice) into the Secondary axis drop zone, as shown above.
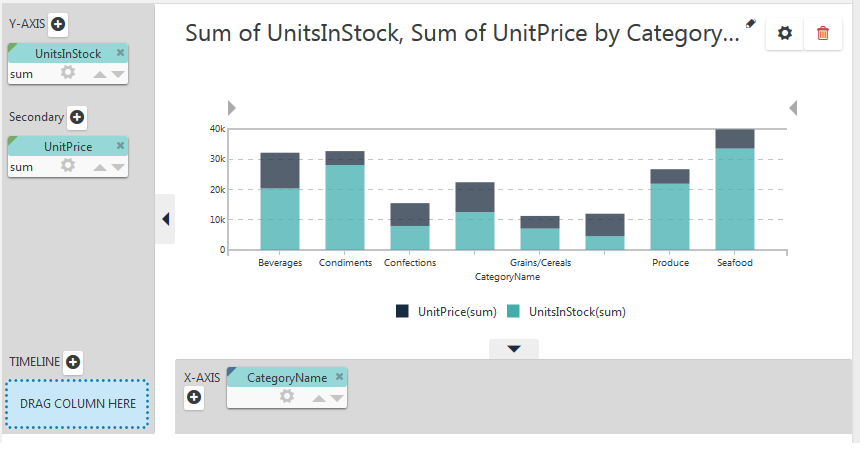
Your chart will be drawn, with the two series stacked, as shown above.
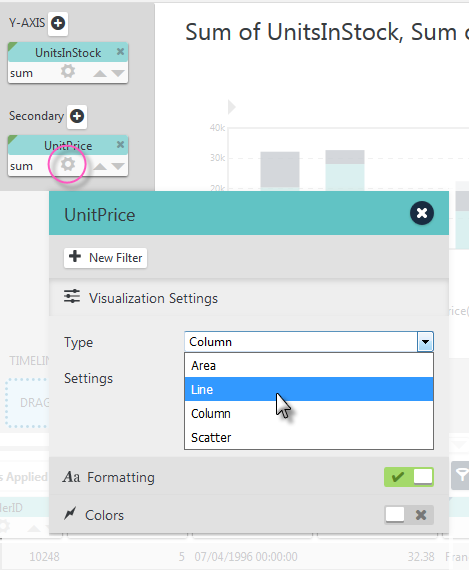
Next, click the Secondary pill's gear icon and select the Visualization Settings in its gear menu, as shown above. You can now choose a different chart type for the secondary data. We'll choose a Line chart for this example.
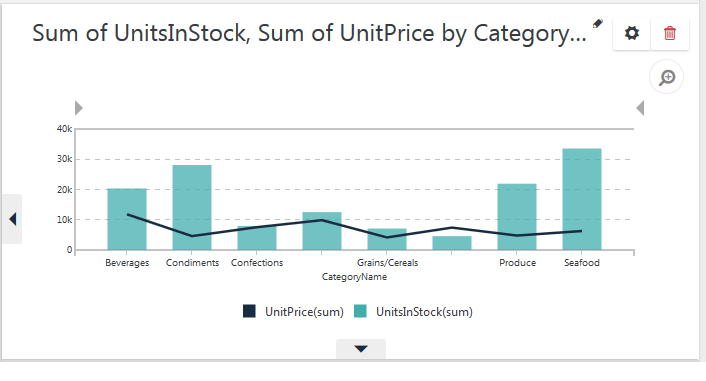
And the resulting chart is shown above.
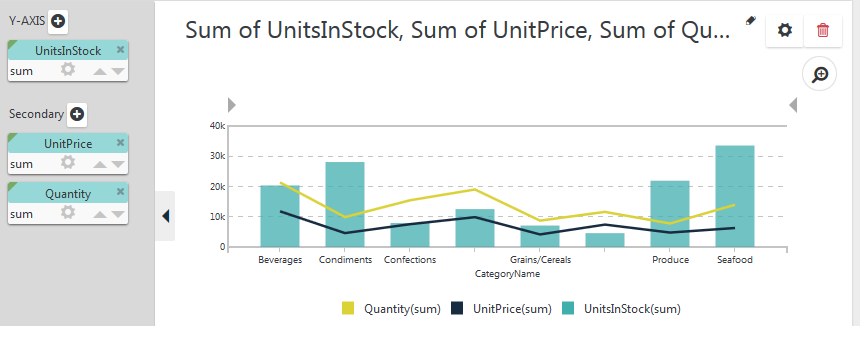
You can add more series by dropping more pills in the Secondary drop zone and the chart will add them, as shown above. Their chart types will default to that of the last pill added.