Thinkspace - Available Chart Types
The Thinkspace is capable of producing a variety of charts and the following table shows an example of each one, with a brief description:
| Sample Chart | Description |
|---|---|
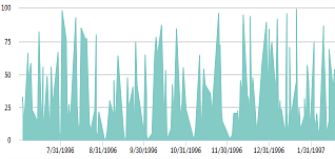 | An Area chart is similar to a Line chart. However, the area between axis and line are commonly filled-in and emphasized with colors, textures, or cross-hatchings. Typically, this chart is used to compare two or more quantities. |
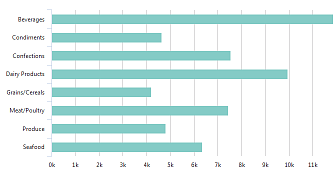 | A Bar chart presents grouped data as horizontal rectangular bars, with bar lengths proportional to the values that they represent. It's most commonly used to show comparisons among categories. The Y-axis of the chart shows the specific categories being compared, and the X-axis represents discrete values. Values from multiple series may be "stacked" one atop the other, or grouped side-by-side. |
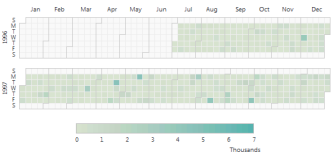 | A Calendar chart is a Heatmap-style visualization of time-series data. It uses color gradients to show how data varies over a span of time and can be useful for discovering correlations between events and specific days. |
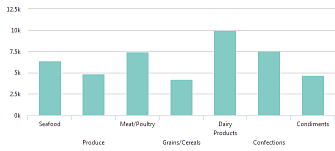 | A Column chart presents grouped data as vertical rectangular bars, with bar lengths proportional to the values that they represent. Its most commonly used to show comparisons among categories. The X-axis of the chart shows the specific categories being compared, and the Y-axis represents discrete values. Values from multiple series may be "stacked" one atop the other, or grouped side-by-side. |
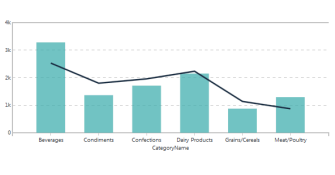 | A Combo chart displays multiple data series in overlapping chart styles, making it easy to compare values for different columns or values. A Column + Line chart is shown in the image at left. A secondary axis can also be displayed. |
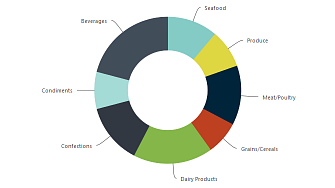 | A Donut chart is related the Pie chart, however its center is a "hole", providing a different look. It's divided into slices to illustrate numerical proportion, and the arc length of each slice is proportional to the quantity it represents. |
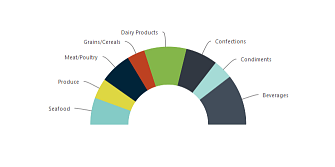 | A Semi-Donut chart is similar to the Donut chart, but limits itself to one-half of a circle. It's divided into slices to illustrate numerical proportion, and the arc length of each slice is proportional to the quantity it represents. |
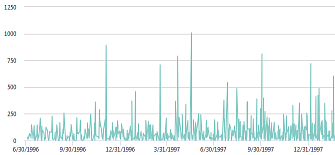 | A Line chart displays information as a series of data points connected by straight line segments. It's a basic type of chart common in many fields. It is similar to a scatter plot except that the measurement points are ordered (typically by their x-axis value) and joined with straight line segments. A line chart is often used to visualize a trend in data over intervals of time – a Time series – and so the line is often drawn chronologically. |
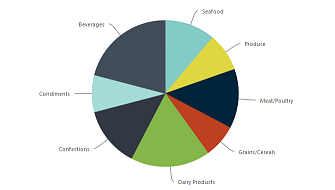 | A Pie chart is a circular statistical graphic, which is divided into slices to illustrate numerical proportion. In a pie chart, the arc length of each slice is proportional to the quantity it represents. |
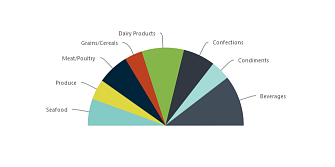 | A Semi-Pie chart is similar to the Pie chart, but limits itself to one-half of a circle. It's divided into slices to illustrate numerical proportion, and the arc length of each slice is proportional to the quantity it represents. |
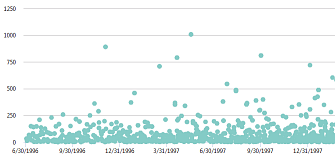 | A Scatter chart uses Cartesian coordinates to display values for several data sets. The data is displayed as a collection of points, each having the value of one variable determining the position on the horizontal axis and the value of the other variable determining the position on the vertical axis. |
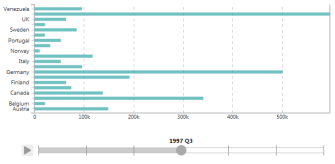 | The animated Timeline displays snapshots of the data based on time intervals, in an automatically-updated chart. Like a video, it can be started and stopped at various points in time so that the resulting chart can be examined. |
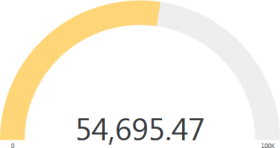 | An Arc Gauge is most useful for showing an aggregation of values in a single column. It displays a fixed numeric value with an indicator depictingprogress towards a maximum value. The color of the indicator changes from red, to yellow, to green as the maximum value is approached. |
 | A Bullet Gauge is most useful for visualizing an aggregation of values in a single column. They display information in a more compact and easier-to-read format than circular gauges. |
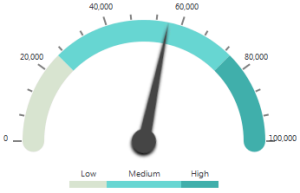 | Like the Arc Gauge, the Dial Gauge is most useful for visualizing an aggregation of values in a single column. It does this in an attractive way and it's also a familiar object, given its similarity to those used in automobile dashboards. |
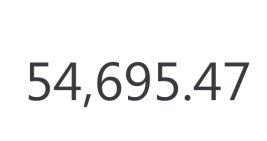 | A KPI Gauge, like the other gauges, is most useful for visualizing an aggregation of values in a single column. It simply displays the aggregated value in a large, clear font, without any other graphic elements. |
The Thinkspace "recommendation engine" will automatically propose the best chart types for displaying your data, and data point tooltips are generated automatically.
Chart options include filtering the data with a "Crosstab Filter", applying groupings, and showing percentages.
Once you've selected a chart type, you'll almost certainly want to try working with different data, isolating data, and apply modifications. Here are some common chart activities: