Thinkspace - Adding Mark Lines
Mark Lines are lines on a chart's canvas, related to its Y-axis data values, making it easy to compare data to target values.
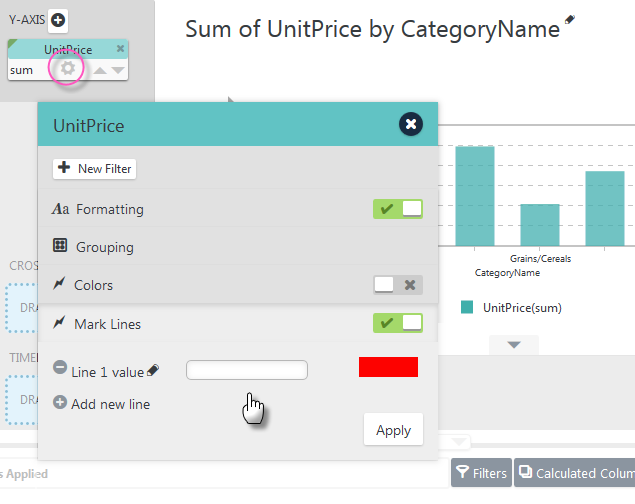
To add Mark Lines, click a Y-Axis pill's gear icon and select Mark Lines in its gear menu, as shown above.
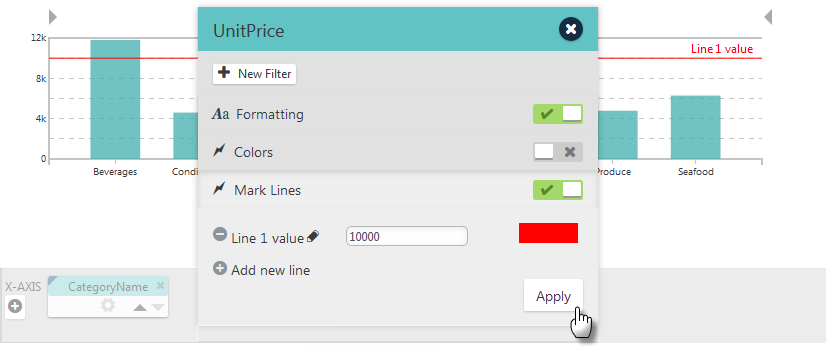
Enter a value for the first line, 10000 in the example above, and click Apply. The resulting line and its caption are shown on the chart in the background.
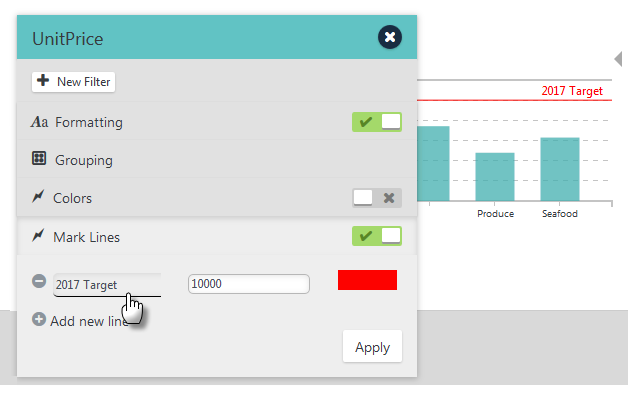
The line's caption can be edited by clicking the "pencil" icon, making changes, and clicking Apply, as shown above.
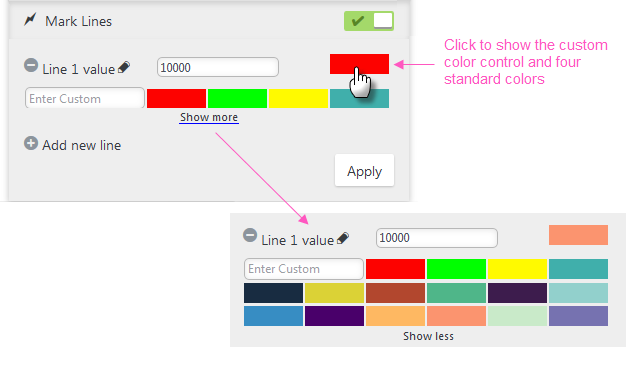
To change the line's color, click the assigned color swatch to show the standard colors and the Show more link
to show even more colors. You can also enter custom color values directly as
hex ("#CCCCCC"), RGB ("rgb(197, 95, 169)"), or text ("Blue") values.
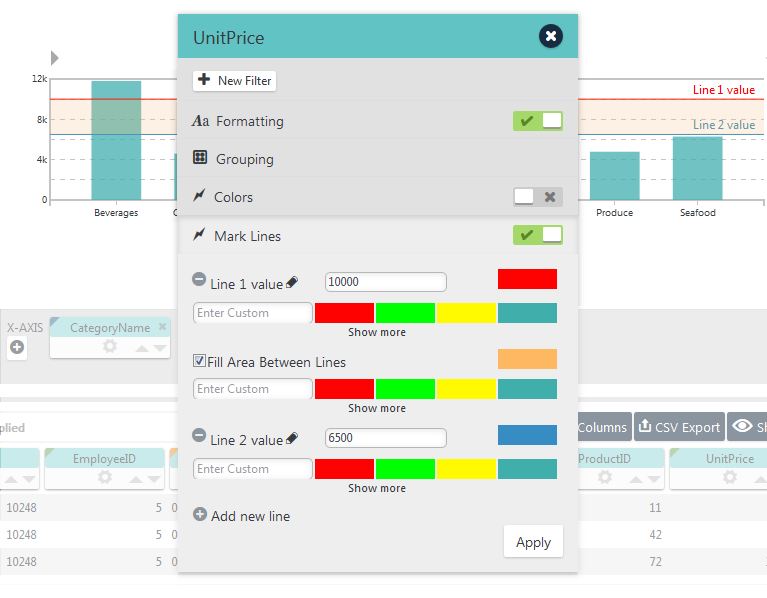
You can add and remove Mark Lines using the ![]() icons and even fill the area between them, as shown above.
icons and even fill the area between them, as shown above.