InfoGo - Adding to Your Visual Gallery
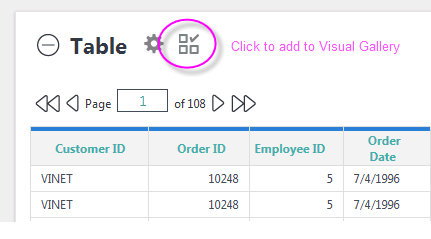
As you created tables and charts, you probably noticed that each panel included an Add to Visual Gallery icon.


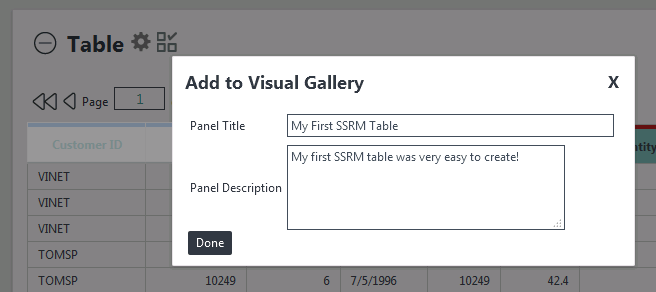
When you click the icon, you'll be prompted for a title and description. These, and a thumbnail image of your visual, are stored in your personal Visual Gallery.
You can see and manage your Visual Gallery when using either of the Home page Design options. You use the visuals from your gallery when creating Dashboards and Reports.
Visualizations as Bookmarks
![]() InfoGo now stores visualizations as bookmarks, not in Gallery or Extra Gallery files. Information about migration of existing gallery items into bookmarks can be found in Upgrade the Self-Service Reporting Module.
InfoGo now stores visualizations as bookmarks, not in Gallery or Extra Gallery files. Information about migration of existing gallery items into bookmarks can be found in Upgrade the Self-Service Reporting Module.

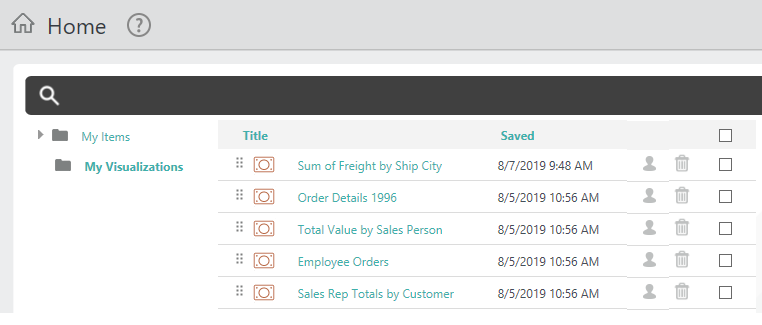
Stored visualizations appear in the My Visualizations folder, as shown above, and/or in its sub-folders. If Sharing has been enabled, you can share visualizations with other users. Click a visualization's title to view it:

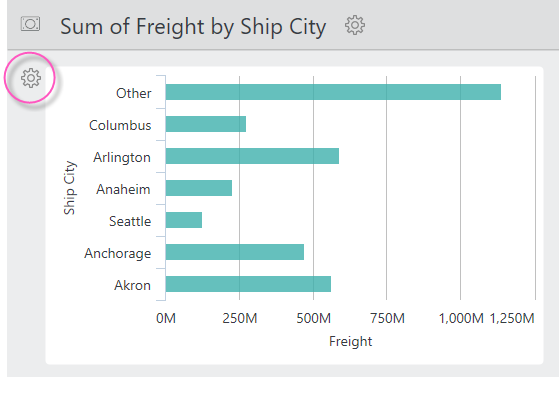
In the visualizaton viewer, you can rename, duplicate, or delete the visualization. Click the gear icon shown circled above to edit the visualization in a pop-up panel.