Thinkspace - Profiling a Column
The Thinkspace also lets you "profile" a data table column. A column profile displays statistics, such as minimum, maximum,
average, and average for Numeric columns, and minimum and
maximum for DateTime columns. It can also help you
identify problems in your data such as invalid dates, such as
a maximum date that's
in the future.

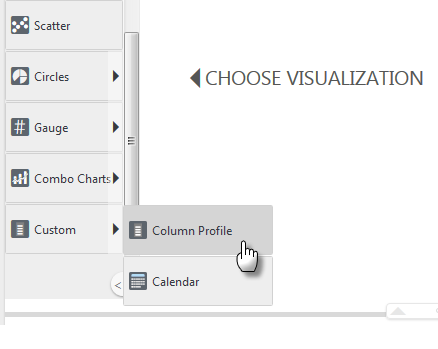
To create a column profile, start with a clear Thinkspace and scroll down in the Visualizations menu, as shown above, and select Custom![]() Column Profile.
Column Profile.

Drag-and-drop a Numeric column pill, like Freight, into the blue drop zone, as shown above.

The column profile will be displayed, as shown above. The profile for the Freight column includes minimum, maximum, average, and sum statistics. The statistics for other columns will vary, depending on column data type.

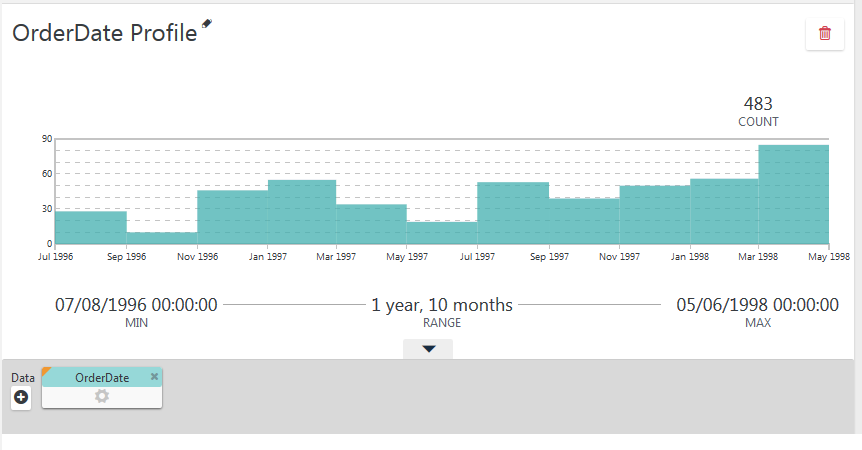
Replace the Freight column pill with the OrderDate pill and you can see the differences, shown above.
Other Discovery Module v3.x topics include: Thinkspace Charts and Thinkspace Crosstabs.