Thinkspace - Adding In-Cell Graphics
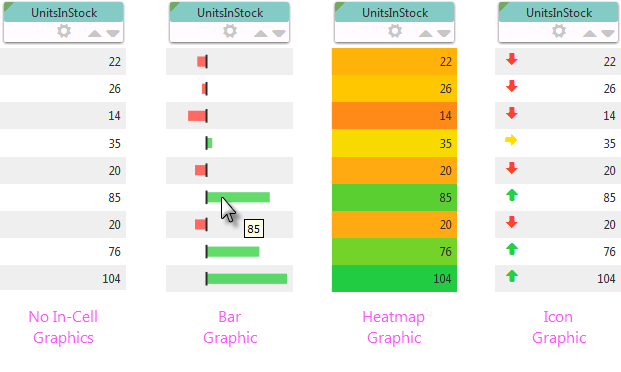
Number-type data table columns can include "In-Cell" graphics to make it easier to understand values and compare them at-a-glance:

The available In-Cell graphics are shown above. The Icon graphic can consist of arrows, circles, or squares. Here's how to use these graphics:

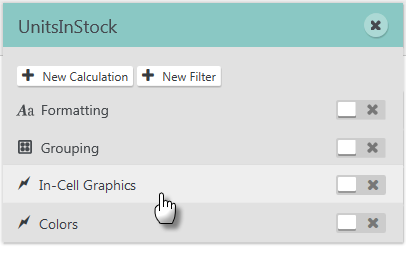
Click In-Cell Graphics on a Number column's gear Menu, as shown above, and the menu option will expand to show a panel of options:

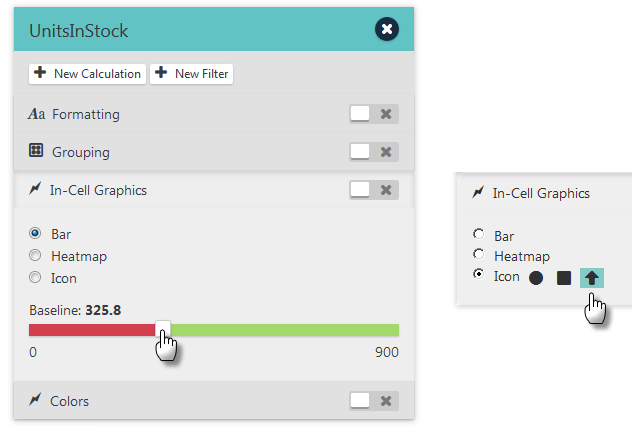
The Bar and Heatmap options present a Baseline slider, which lets you specify a baseline value for the graphic. The Icon option provides three graphic options: Circle, Square, and Arrow. Icon values, which determine colors and arrow icon direction, are evenly distributed in percentage thirds (less than 33%, 33% to 66%, greater than 66%). Click Apply to immediately display the graphics. The sliding Enable/Disable switch can be used to turn In-Cell graphics on and off.