Creating Dashboards
To create a new dashboard, click the Create Dashboard tab:
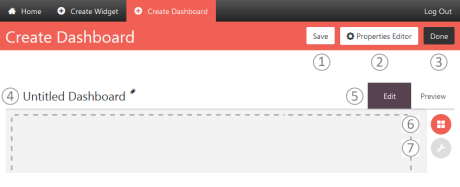
The controls available include:
- Save - Click to save your work. The dashboard itself will be saved as a widget and appear as a tile in the Home page.
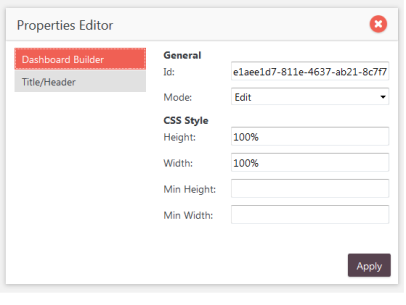
- Properties Editor - Click to edit the widget properties, including title,header, and styling:
- Done - Click to return to the Home page.
- Title - Click the "pencil" icon to edit the default title.
- Edit/Preview - Click to switch modes. In Preview mode, editing controls are not displayed.
- Open Infoboard - (Edit mode) The Infoboard, a slide-open panel revealed when you click the
 icon, is a gallery of the available widgets.
 - Open Filter Widgets - (Edit mode) A slide-open panel revealed when you click the
 icon, is a gallery of the available standard widgets.
Adding Widgets to the Dashboard
To add your visualization or HTML widgets to a new dashboard, open the Infoboard and find the widget you want to use.
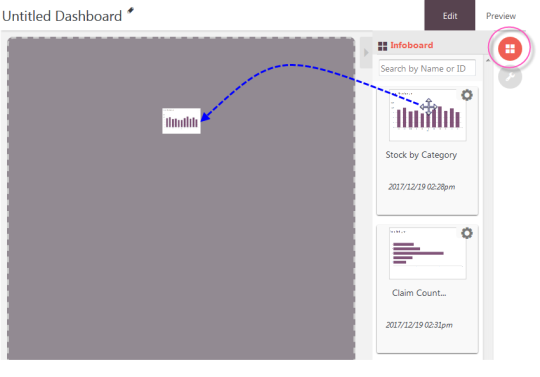
Drag-and-drop the widget from the Infoboard onto the dashboard, as shown above.
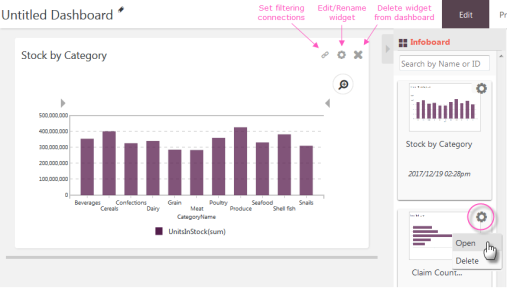
Once dropped, the widget expands, gets its data, and renders its visualization, as shown above. Three icon appear on the widget in Edit mode that let you set filtering (more about this later), edit/rename the widget, and remove the widget from the dashboard. These icons do not appear in Preview mode or at runtime.
The widgets in the Infoboard have their own gear icons, with menus options that let you open the widget in the Thinkspace, for editing, or delete it entirely from your collection of widgets. Find the next widget you want to add to the dashboard. You can use the same widget multiple times in the same dashboard. For example, one instance could be normal and the other zoomed in on specific data.
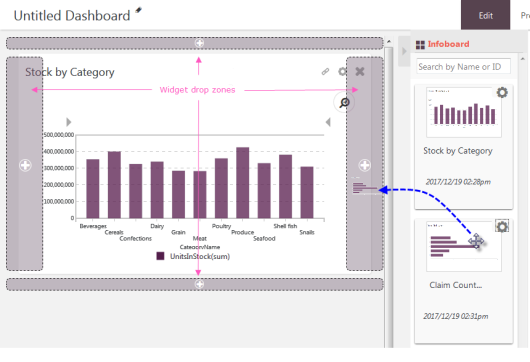
Drag the next widget onto the dashboard and "drop zones" will appear, as shown above. Drop the widget onto one of them to place it above, below, left of, or right of the first widget.
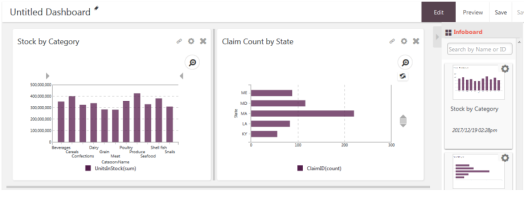
The result is shown above. You can continue to add widgets as desired and they'll be automatically scaled to fit the space. Due to space constraints, you can only place four widgets side-by-side across the dashboard.
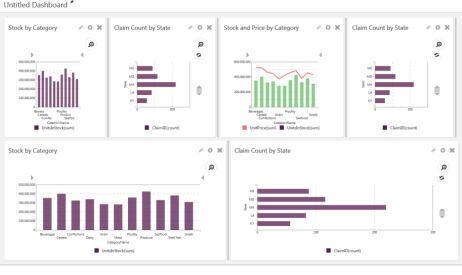
You can have different numbers of widgets in different rows, however, as shown above.
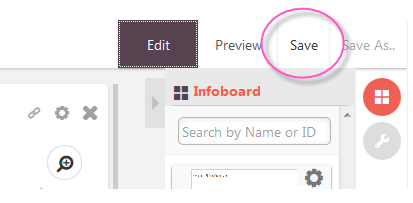
Once you start adding widgets to the dashboard, the Save button, shown above, will be enabled. Click it to save the dashboard to its own widget, which will appear on the Home page with the visualization widgets.
Resizing and Rearranging Widgets
You can resize and rearrange the widgets in a dashboard, as follows:
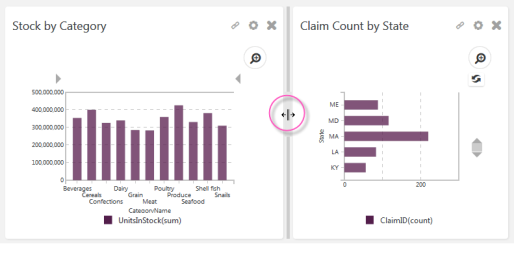
A gray "resizing bar" separates the widgets, as shown above. If you have several rows of widgets, there will also be horizontal resizing bars. Place your cursor on the bar and drag it to resize the widgets.
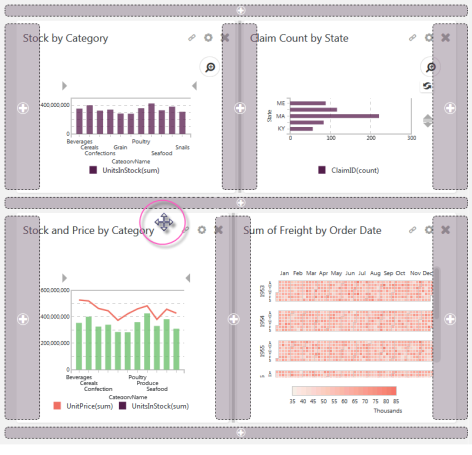
To rearrange widgets, click a widget title area and begin to drag. Drop zones will appear around all of the widgets, as shown above. Drop the widget in the desired location.