Adding a Polygon Overlay
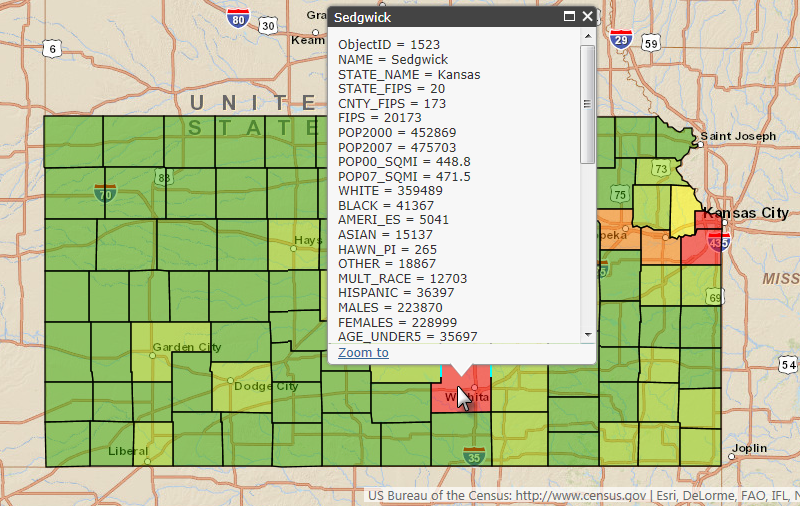
In this example, we'll draw a state map and add an overlay layer of polygons, representing the state's counties and reflecting their population size. This will be driven by U.S. Census data from an online source and we'll use the JavaScript from the ArcGIS Sample web site to render it, using API v3.9.

Once again, we'll begin by adding a Style element, as shown above, to a new definition. The style sheet for this example is: http://js.arcgis.com/3.9/js/esri/css/esri.css


Next, we add the JavaScript code to create and initialize the map. The code has been taken from the example at https://developers.arcgis.com/javascript/jssamples/renderer_class_breaks.html and saved into a file, ArcGISExample.js, in the application's _SupportFiles folder.

And, once again, we add a Division element, as shown above, which will be the ArcGIS map container. Its attributes are set to give it a unique ID and to ensure that it's rendered as a DIV tag. You can control the size of the map by using CSS to set the height and width of this container element. Let's have a look at the JavaScript in the ArcGISExample.js file:
var map;
require([
"esri/map", "esri/layers/FeatureLayer",
"esri/InfoTemplate", "esri/symbols/SimpleFillSymbol",
"esri/renderers/ClassBreaksRenderer",
"esri/Color", "dojo/dom-style", "dojo/domReady!"
], function(
Map, FeatureLayer,
InfoTemplate, SimpleFillSymbol,
ClassBreaksRenderer,
Color, domStyle
) {
map = new Map("divMap", {
basemap: "streets",
center: [-98.215, 38.382],
zoom: 7,
slider: false
});
var symbol = new SimpleFillSymbol();
symbol.setColor(new Color([150, 150, 150, 0.5]));
// Add five breaks to the renderer
// If you have ESRI's ArcMap available, this can be a good way to determine break values
// You can also copy the RGB values from the color schemes ArcMap applies, or use colors
// from a site like www.colorbrewer.org
//
// alternatively, ArcGIS Server's generate renderer task could be used
var renderer = new ClassBreaksRenderer(symbol, "POP07_SQMI");
renderer.addBreak(0, 25, new SimpleFillSymbol().setColor(new Color([56, 168, 0, 0.5])));
renderer.addBreak(25, 75, new SimpleFillSymbol().setColor(new Color([139, 209, 0, 0.5])));
renderer.addBreak(75, 175, new SimpleFillSymbol().setColor(new Color([255, 255, 0, 0.5])));
renderer.addBreak(175, 400, new SimpleFillSymbol().setColor(new Color([255, 128, 0, 0.5])));
renderer.addBreak(400, Infinity, new SimpleFillSymbol().setColor(new Color([255, 0, 0, 0.5])));
var infoTemplate = new InfoTemplate("${NAME}", "${*}");
var featureLayer = new FeatureLayer("http://sampleserver1.arcgisonline.com/ArcGIS/rest/services/Demographics/ESRI_Census_USA/MapServer/3", {
mode: FeatureLayer.MODE_SNAPSHOT,
outFields: ["*"],
infoTemplate: infoTemplate
});
featureLayer.setDefinitionExpression("STATE_NAME = 'Kansas'");
featureLayer.setRenderer(renderer);
map.addLayer(featureLayer);
});
Note these items in the code:
- The "divMap" identifier of our map container Division element is used in the Map constructor.
- In this example, values for the map center point and zoom factor are hard-coded, but they could come from tokens, as in the earlier example.
- Renderer "breaks" relate population data to colors in the polygon overlay (the "FeatureLayer").
- Data for the overlay comes from an ArcGIS online sample source.

Now when the map is displayed the counties are shown in a polygon overlay and the polygons are colored based on their population density. If a polygon is clicked, as shown above, a pop-up panel provides the data for that county. You may need to drag the map southward to see the complete pop-up panel. The pop-up panel can be styled and customized using the API.