Using the Debugging Features
Logi Studio provides debugging features for an application, but they have to be enabled to work. They are not enabled by default.
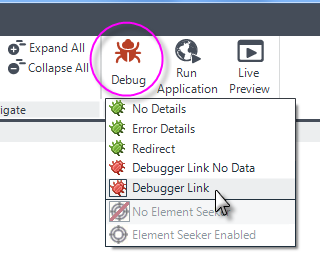
You can turn on debugging for all your report pages by clicking the Debug menu item, shown above, in Studio's main menu in the Home tab and selecting Debugger Link from the options.
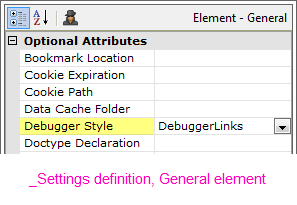
Selecting
a debugger option in the toolbar sets an attribute value in the General element, in the
_Settings definition, as shown above. This value can also be set
manually.
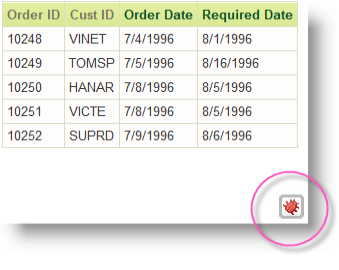
Now, when run, each report page will include a debugger icon that "floats" in the lower right-hand corner of the browser window, as shown above. Click this link to display the Debugger Trace Report (discussed below). Any charts on the page will have their own separate debugger links. You can right-click the icon to open the debug page, open it in a new tab (if displayed in a browser), or in a new window, etc.
Each chart will have its own debug icon or link, as well, and a separate debug trace page.
The other debugging modes include:
- Debugger Link No Data - Produces the same report as Debugger Link, but does not include links to, nor cache, the XML data retrieved. For more discussion of this option, see below.
- Error Details - Appends detailed error at the bottom of a page only when an error occurs.
- No Details - Prevents any debugger information from appearing when there's an error, so the user cannot see sensitive system security information. Use this option for system deployment.
- Redirect - Redirects the browser when an error occurs to a custom error page, at the URL you must specify in the Redirect Error URL attribute.
The default value is No Details.
For information about logging the debugger outpout, see Logging Errors.
Using Debugger Link No Data
Why is Debugger Link No Data useful? When you debug using the standard Debugger Link setting, debug data files are generated for all of the datalayer elements inside your report. Creating these files requires a significant amount of processing overhead and your reports will run slower. How much slower depends on how much data there is, but expect ~2x slower for each datalayer element.
However, if you wish to debug for performance reasons and want to inspect the timings of different events, you can use the Debugger Link No Data setting, which creates no debug data files and incurs no processing overhead, to produce a more accurate execution time profile.
Turning on Debugging with Session Variables
You can also turn on debugging for all users by setting Session variables. To do this, use the Set Session Variables element, and set these two variables:
rdDebugSession="True"
rdDebuggerStyle="DebuggerLinks" (can be any of the debugging modes listed earlier)
Debugging will be turned on for the duration of a user's session. Because the Set Session Variables element has a Condition attribute, you can make debugging dynamic, for example, by adding a parameter and value to the query string used to call a report, then evaluating its @Request token in the Condition attribute:

Enabling Debugging with Security Rights
You may wish to enable debugging just for specific users, without enabling it for all users. To do this:
- Logi Security must be enabled, and users must have security rights assigned to them.
- In the _Settings definition's General element, specify the appropriate security rights as a comma-separated list in the Debugger Security Right ID attribute value.
- Set the General element's Debugger Style to No Details or leave it blank to ensure debugging is not enabled for all users.
- Run the application, and pass rdDebugSession=True to the page in the query string.
Debugging will remain enabled for users with the specified security rights for the duration of their session.
<Label Caption="Enable Debugging" SecurityRightID="Admin">
<Action Type="Report">
<Target Type="Report" />
<LinkParams rdDebugSession="True" />
</Action>
</Label>
The example code shown above will create a link that will be visible only to users with the "Admin" security right ID and, when clicked, will enable debugging for them (assuming Debugger Security Right ID has also been configured with that security right ID).
The Debugger Trace Report
When the Debugger Style has been set to Debugger Link or Debugger Link No Data, the Debugger Trace Report can be accessed in two ways: using the Debug icon or link discussed earlier, or from a link that appears on a runtime error page. The trace report appears either in the Preview panel or in your browser, depending on which method you were using to view your report.
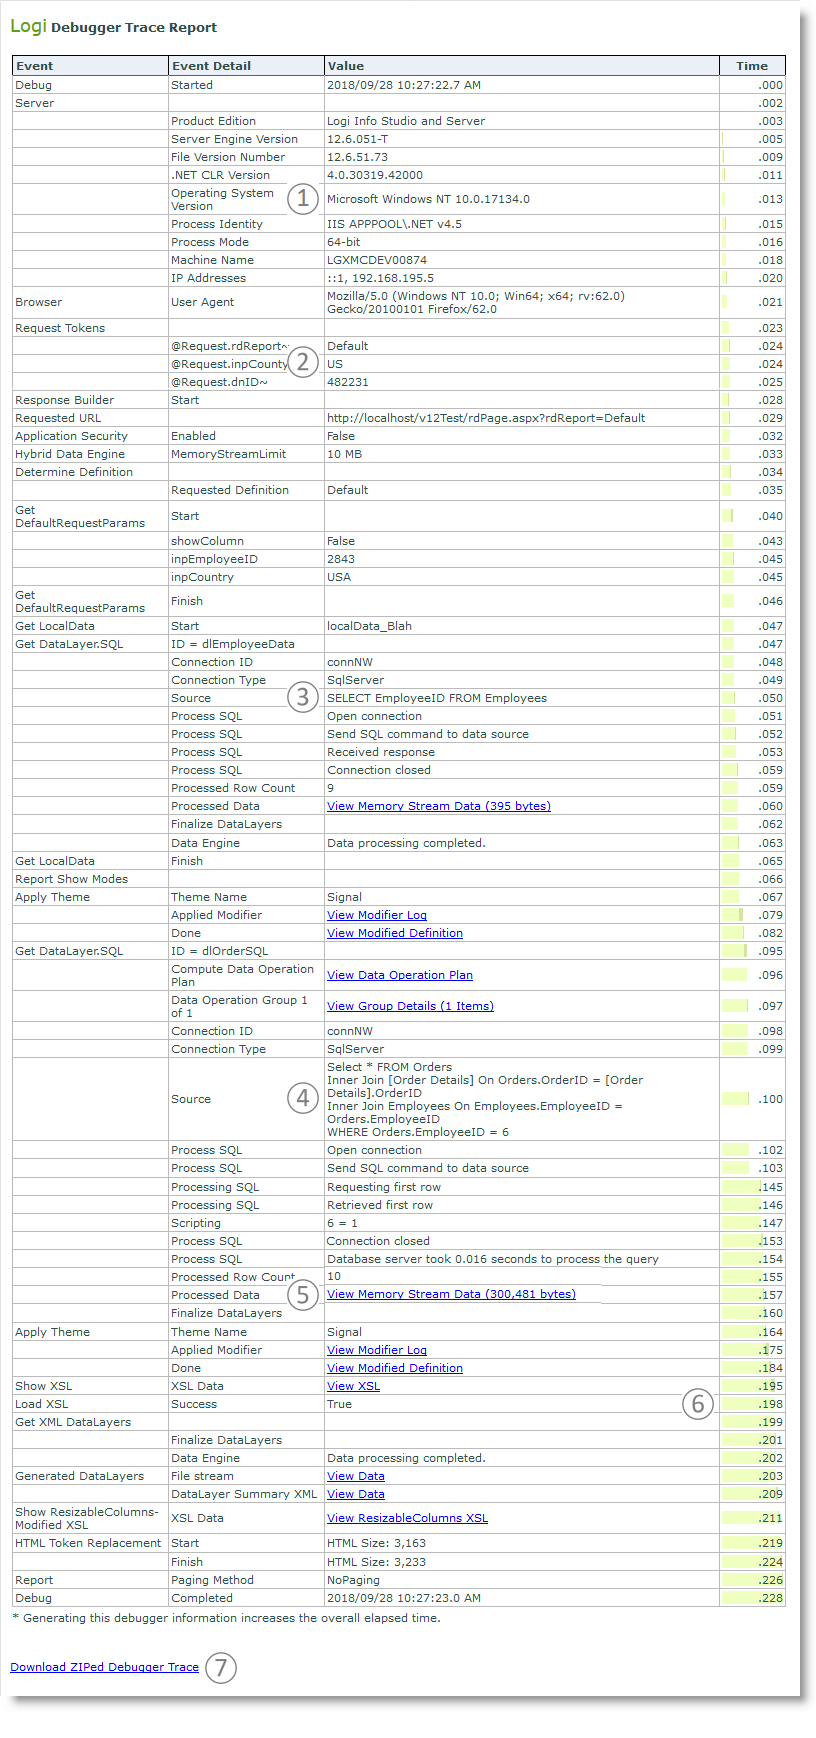
As shown above, the Debugger Trace Report, includes step-by-step events, values, and time stamps for the report run. Tracing application execution is very useful for troubleshooting, especially for data retrieval issues. Here are some of the items you'll find in the trace report:
- Valuable information about Logi Info, the system environment, and the requesting browser.
- The Request Tokens for query string variables being passed to the report, which can be helpful in determining what is being passed from other reports, including from user input.
- Local Data datalayer activity, such as a SQL query issued to a database, is shown. This is especially useful if a query includes tokens being resolved at runtime. SQL queries shown here can be copied and pasted into Studio's Query Builder or other tools in order to run and test them independently. Data retrieval and manipulation is optimized under one or more "data operation plans" to reduce data cache reads and writes. Plan information appears in this section of the debug report.
- Other datalayer activity, including complex SQL queries with resolved tokens, can be also be viewed.
- If the Debugging Style selected was Debugger Link, then after retrieval and subsequent processing with condition filters, joins, calculated columns, grouping, etc., the data in the datalayer can be viewed, either as a neatly-formatted table or as the stored raw XML.
- The Time column, with its integrated chart, provides valuable performance information for each step. This allows you to pinpoint which operations are taking the most time.
-
This link at the bottom of the page will package and compress the debug report into a single .zip file, should you need to provide it to Logi Tech Support for diagnosis.
- If you're working with a Logi Java application, the Trace Report will also include a special section near the top that presents information about your Java configuration.
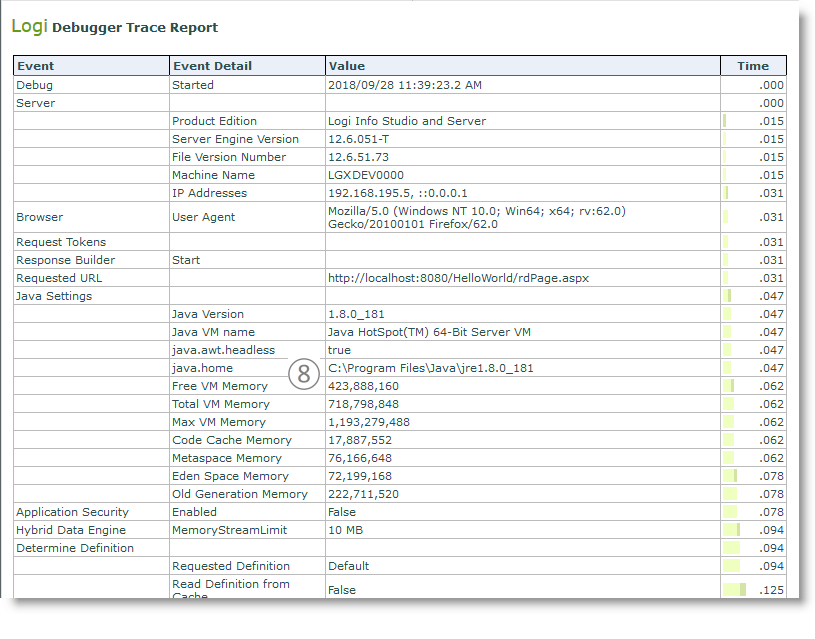
The debug report also contains more than the information highlighted here, so examine it carefully.
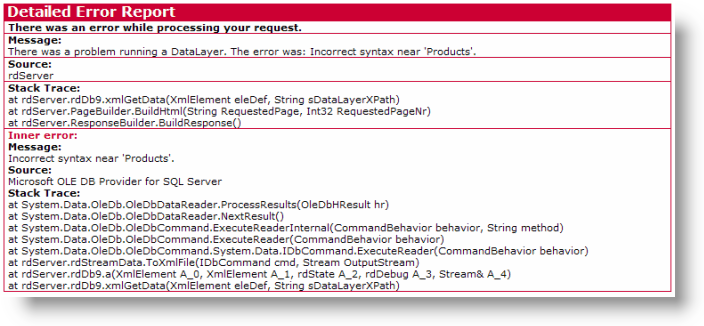
In addition, if an error has occurred, a Detailed Error Report, shown above, including the stack trace will also appear, often with a more detailed error message to aid in debugging.
 Developers can integrate modern logging framework using Log4Net and Log4J.
 ![]() You must update to Log4j v2.15 to mitigate this 0 day vulnerability. For more information about this vulnerability, refer to this statement.
You must update to Log4j v2.15 to mitigate this 0 day vulnerability. For more information about this vulnerability, refer to this statement.
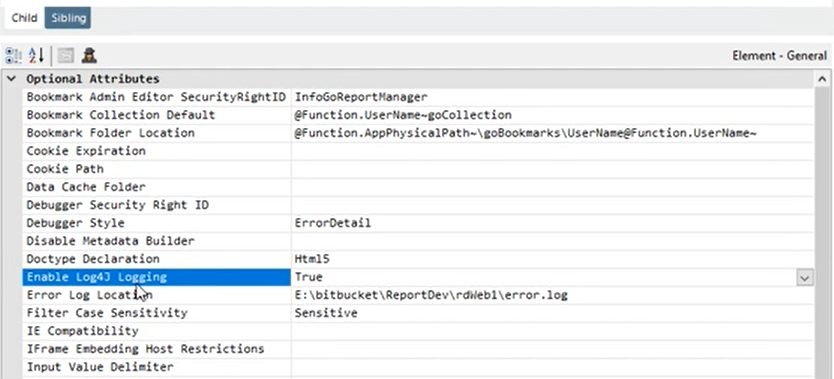
To pull runtime error and debug information into log files directly, set the attribute "Enable Log4J Logging" to "True":
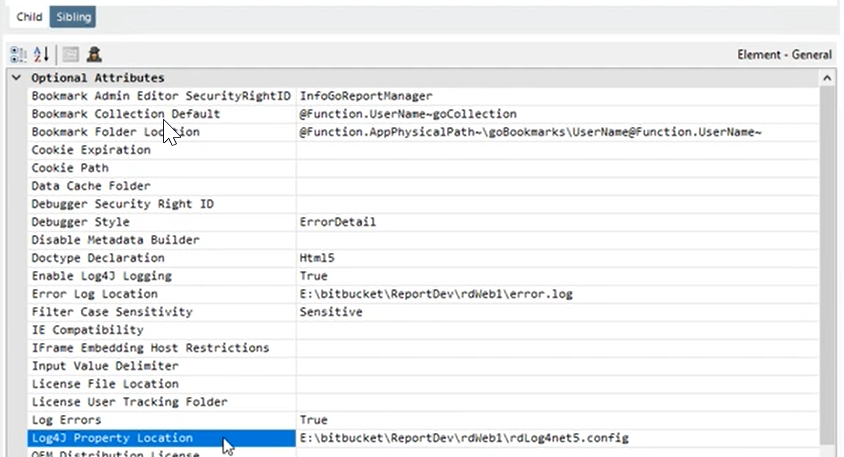
Then, enter a file location in the "Log4J Property Location" attribute, as shown below:
Below is an example of a log4J properties file:
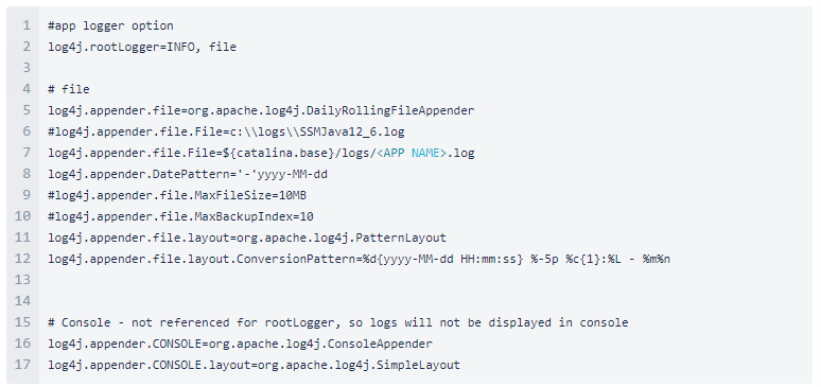
Developers can configure the application to log different logging levels through the property file.
| Log4J | Logi Info |
|---|---|
| DEBUG | Debugger No Data |
| INFO | Event Logging |
| WARN | Warning |
| ERROR | Error Details |
| OFF | Disabled Logging |
Configuring the Debugger for Java Implementation
For Java implementations there is a separate XML file that needs to be configured in _Settings General:
rdDebuggerStyle="NoDetail" EnableLog4JLogging="True" Log4jPropertyFile="/usr/share/tomcat/webapps/InfoGo128/rdLog4j2.config.xml"
![]() Sample sets configuration status = "debug", which puts superfluous configuration messages in catalina.out with Tomcat; WARN is a better level for implementation.
Sample sets configuration status = "debug", which puts superfluous configuration messages in catalina.out with Tomcat; WARN is a better level for implementation.
Please refer to the example below:
<?xml version="1.0" encoding="UTF-8"?> <Configuration status="WARN"> <Appenders> <File name="RollingFile" fileName="/usr/share/tomcat/webapps/InfoGo128/logs/rdLog4j.log"> <PatternLayout> <Pattern>%d %p %c{1.} [%t] %m %ex%n</Pattern> </PatternLayout> </File> </Appenders> <Loggers> <Root level="debug"> <AppenderRef ref="RollingFile"/> </Root> </Loggers> </Configuration>
Debugging Scripts
You can also cause debugging to extend to scripts:

To enable this, configure the General element's Script Source Debugger Style attribute. Its None value is the default, or you can set it to OnError, in which case the View Script File link shown above appears in the Debugger Trace Report when an error occurs. This link displays the script as generated when the report was run. If the script is a simple, single line of script, the actual error may appear here instead of a link. A third value option, Always, causes the
link
to appear in the trace report at all times. The routine use of "Always" is discouraged as it will incur a significant performance hit.
Debugging Subreports
If you're working with subreports and a subreport encounters an error, the error message and debug link may appear in a very small iFrame on the parent report page, like this:
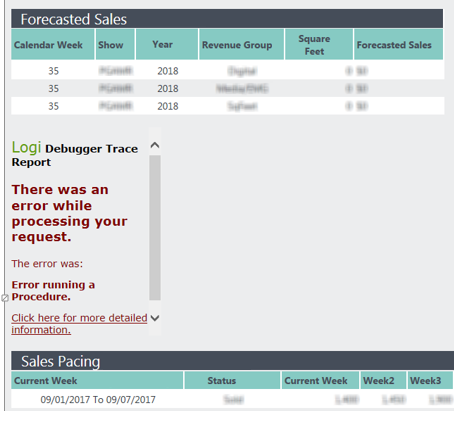
It's nearly impossible to view and navigate around the debugger trace report after clicking the link. What to do?
The simplest solution is to temporarily change the SubReport element's SubReport Mode attribute value to Embedded. The error message and debug trace page will then expand to the full width of the parent report. Change it back to its original value when you're done debugging.
If, for some reason, you can't change the SubReport Mode, then you need to open the error message or the debug trace page at full-size in a new browser tab or window. Unfortunately, different browsers have different requirements for this, as follows:
Firefox: Right-click the error message and select the "This Frame" and then "Open Frame in a New Tab" or "Open Frame in a New Window" option.
Chrome: Chrome removed its "Open Frame in a New Tab" option some years ago, but you can re-enable it with the free Open Frame extension from the Chrome Store. Once it's installed, right-click the error message and select the "Open frame" and then "Open frame in new tab" or "Open frame in new window" option. If you don't want to install the extension, follow the instructions below for IE11.
Microsoft IE11: Right-click the "Click here for more detailed information" link and select "Inspect element". The Developer Tools panel will open with the error message source code in it. Scroll up in it to the tag that begins with <body rddbugurl= and double-click the long value that starts with rdDownload/ to select it. Right-click the selected value and click "Copy". Manually open a new browser tab and type in the URL for your Logi application, stopping just before rdPage.aspx. Paste the copied long value in after the slash and press Enter.
Microsoft Edge: Use the same instructions as above for IE11. When you right-click the "Click here for more..." link, you will see options to open a new tab or window but they won't do anything, so carry on with the "Inspect element" option and other instructions above.