Metadata Setup in SSRM
Self-service Reporting Module provides analytic capabilities to business and power users to perform queries and generate reports on their own with limited support from internal IT organizations. It includes metadata to simplify the underlying data model for ease of understanding and direct data access.
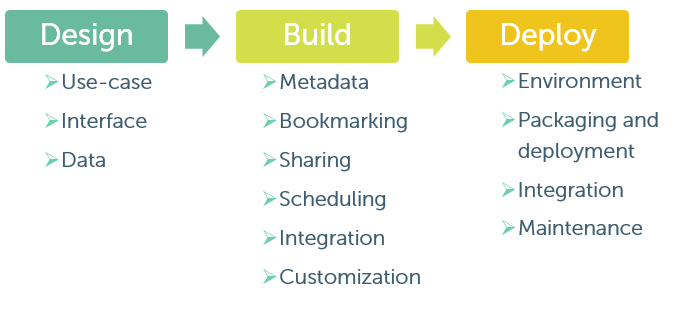
SSRM Getting Started Process:

At a high-level, SSRM capabilities include:
- Report Management interface where users manage, schedule, and share dashboards, reports, and analyses.
- Data Discovery for users to quickly visualize new insights with features like automatic data grouping, customizable in-cell graphics, and best-fit chart recommendations.
- Report Layout Editor for users to design and format print-ready reports with data visualizations.
- Query Builder for users to select the data sources they have access to, choose specific data for analysis and feed this data into the analysis grid to create visualizations.
- Metadata Builder for IT and developers to define recognizable table and column names for users to query their data.
- InfoGo a pre-built Logi Info application, dramatically reducing time-to-deployment.
Designing Metadata
The most comprehensive approach to designing metadata involves gathering the requirements directly from the business users. Logi follows a methodology for gathering analytics requirements that can be applied here:
- Identify key users – Look for power users specifically interested in building their own reports and dashboards on key metrics
- Identify common personas or groups in this user list – often users in the same job role – that share a specific reporting need. For example Sales Managers interested in summary sales data and detail at the line item level, but perhaps not inventory information.
- Interview users within each of these personas to find out what they’re looking for out of self-service reporting. Logi recommends 60 to 90 minutes per persona. The key to this step is to focus on the information they need to successfully do their jobs – users don’t necessarily have a design in mind to define a report they want to build or know how the underlying data model works, but they know what information they need. Instead of, “What reports do you need to run?” consider the following questions (tailored to fit the context of the audience you’re interviewing):
- What information do you need in your role on a daily/weekly/monthly basis?
- What info do you need to provide to others?
- Where do you go for information today?
- What challenges are there in getting access to info? - Identify the common reporting questions (SSRM use cases). From the information collected in each interview, look for the specific measures or metrics users mention and why they use these. For example, a Supplier handling multiple providers needs to see MTD total sales figures by location, to find out whether any are under-performing so that adjustments can be made at those locations.
- Fit the use cases to the source data. Track the questions raised by user persona and map these to the reporting database to define the new metadata approach:
- What entities and events have to be present in the metadata for the user to be able to build a report that answers their need? Consider this the logical model for the SSRM metadata design.
- What fact and dimension columns from the source reporting database (physical data model) map to these entities?
- Will data aggregate correctly if the physical model is surfaced directly to SSRM, or should a view be created to pre-aggregate or pre-calculate information that SSRM will then read from? This information informs the final SSRM data model.
- What is the time-frame of the data?
- Are there use cases for live data versus historical comparison?
- Which of these records are likely to change? How frequently? - Develop and test the new metadata structure on the same list of users. Recommended approach: sit with users as they attempt to create a report based on one of the questions they raised during the interview process. Real-time feedback will allow your team to adjust metadata configuration quickly and plan a wider rollout.
Logi recommends changing the metadata development approach to present only what users actively need for reporting. This should include splitting up a single metadata collection into several more that address common subject areas in the source data that users are querying, instead of using a single metadata collection that represents the underlying physical model almost exactly. This may limit flexibility in terms of what can be locked down or exposed to specific user roles in the future.
Table Design Best Practices
- Flattened/Denormalized Schema perform best for reporting
- Limit number of joins to occur at runtime
- pre-Aggregate and apply complex logic in movement where possible
- More joins, tables will give more flexibility but interaction will be slower loading
- For row-level security – Include security-related fields in every row, for example – supplier id, or provider name.
- Split data by grain – Invoices vs Invoice Details
- Optimize for read and query performance – Indexing on columns
- Date – Keep full dates; partial dates (Month-Year) are not recognized as a date dimension