Create Ad Hoc Reports
There are two types of ad hoc reports in Logi Report, Web Report and Page Report. This topic describes how you can create ad hoc reports from the Server Console.
Both web reports and page reports are created from business views in a catalog. Business views have the capability of providing multiple hierarchies that allow for automatic drill-down and drill-up for detailed analysis and slicing and dicing data which is especially powerful using a crosstab component.
To create ad hoc reports, you should have logged onto the Server Console, and disabled the Pop-up Blocker on your web browser. Then:
To create a web report:
- In the Start Page of the Server Console, select Web Report in the Create category.
Server displays Web Report Studio in a new tab and prompts you to select data for the new report.

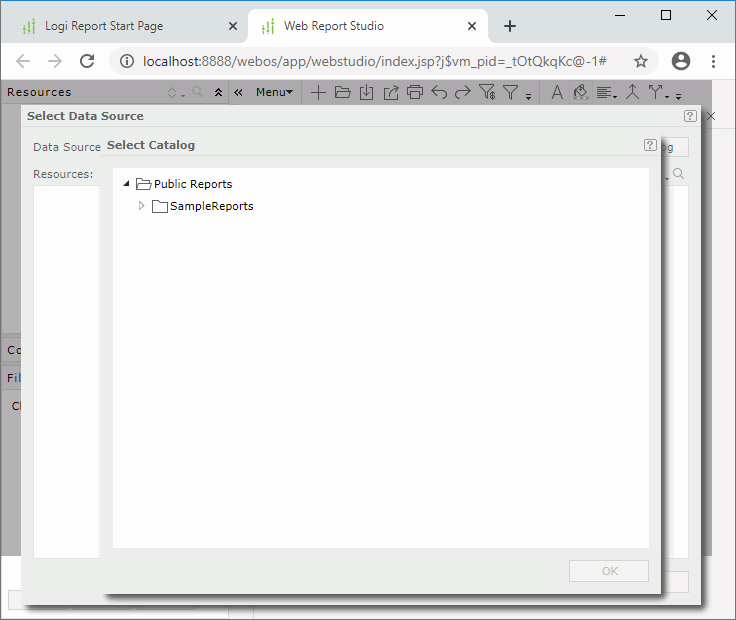
- In the Select Catalog dialog box, select the catalog published to the server resource tree, which contains the data you want to use for the report. Select OK.
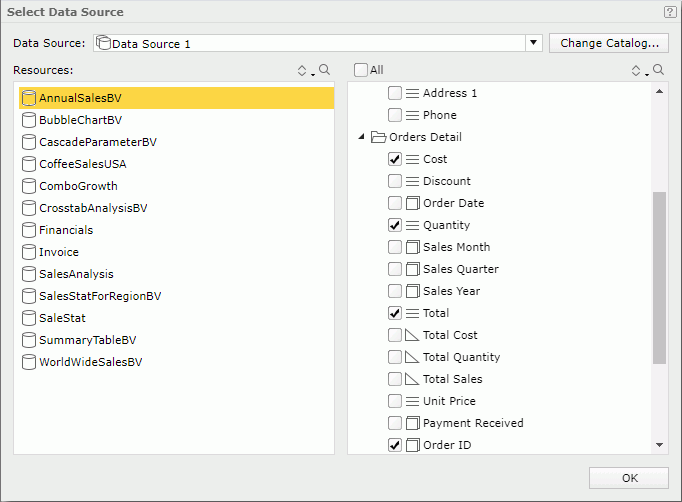
- In the Select Data Source dialog box, select the required data source in the specified catalog from the Data Source drop-down list, the business view in the selected data source in the Resources box, then in the right box, select the data fields you want to display in the report.

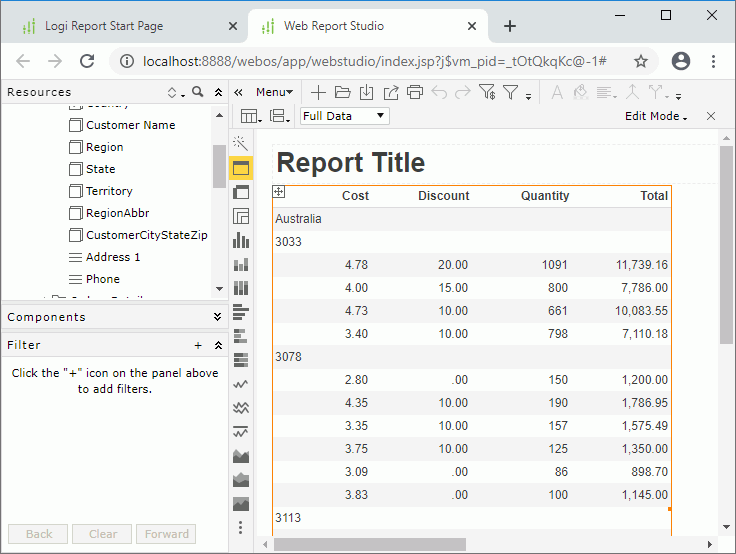
- Select OK. Web Report Studio creates a table based on your selection.

To create a page report:
- In the Start Page of Server, select Page Report in the Create category. Server displays a page for you to choose the catalog you want to use to create the page report.
- Select the folder that contains the catalog and then the catalog. Select OK.
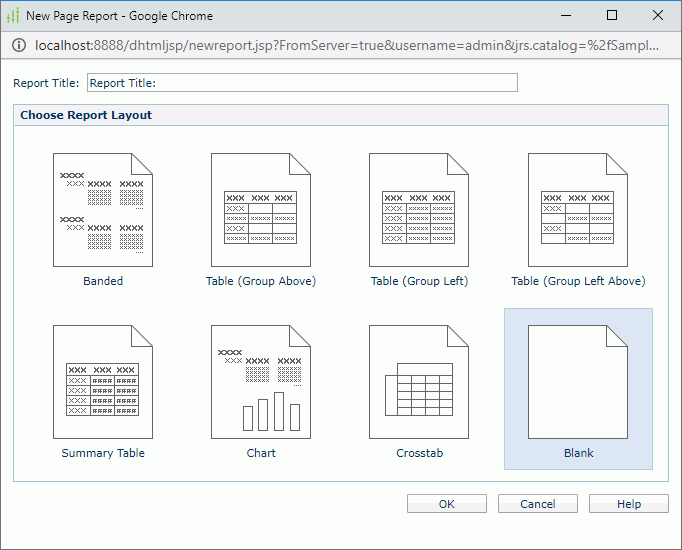
- Server displays the New Page Report dialog box for you to create a page report with the first report tab in it.

- In the Report Title text box, specify the title of the report tab.
- In the Choose Report Layout box, select the layout with which you want to create the report tab.
- Select OK.
- If you select the Blank layout, Page Report Studio creates a blank report. You can then use the Toolbox and the Resource View panels to add objects and view elements to the report.
- If you select the layout of Banded, Table, Chart, or Crosstab, Page Report Studio displays the corresponding wizard. Specify the data to display in the report.
 Previous Topic