Starting a Visual Analysis Session
To start a new visual analysis session from Logi JReport Server:
- Do either of the following:
- On the Logi JReport Server Start Page, select Analysis in the Create category.
- On the Logi JReport Console > Resources page, select New > Analysis.
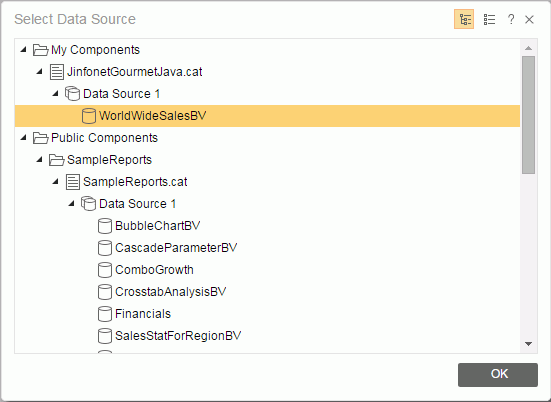
The Select Data Source dialog appears:

- Select the required data source on which to perform visual analysis and select OK.
- The Visual Analysis window will be loaded.
To start a visual analysis session on a saved analysis template:
You should have Execute permission on the analysis template.
- On the Logi JReport Console > Resources page, browse to the analysis template, then do one of the following:
- Select the name of the analysis template.
- Put the mouse pointer over the analysis template row and select the Run button
 on the floating toolbar.
 - Select the analysis template row and select Run > Run on the task bar of the Resources page.
- Select the analysis template row, right-click in the row and select Run from the shortcut menu.
- The Visual Analysis window will be loaded.
To start a new visual analysis session during another session:
- In the Visual Analysis window, select
 > New on the toolbar.
 - In the Select Data Source dialog, select the required one and select OK.
- A new Visual Analysis window will be loaded.
To start a visual analysis session on a saved analysis template during a visual analysis session:
- In the Visual Analysis window, select
 > Open or the Open button
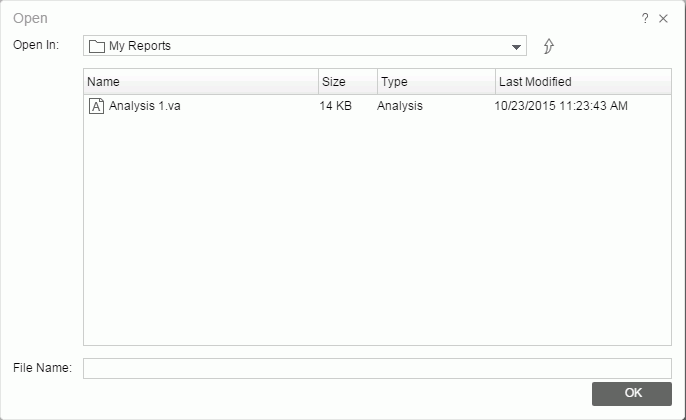
  on the toolbar. The Open dialog appears.

- In the Open In section, browse to the folder where the analysis template is located in the server resource tree. The folder may be Public Reports or My Reports. You can use the button
 to return to the parent folder.
 - Select the analysis template in the resource table which lists all the analysis templates in the current directory. Select the column names to change the order of the templates in the table list if required.
- The File Name box shows the name of the selected analysis template.
- Select OK. The template will be loaded into a new Visual Analysis window.
 Previous Topic
 Back to top