Data Format Dialog
The Data Format dialog appears when you select  to specify the data format for a chart platform or legend in the Report Inspector. The options in the dialog vary according to different sources it is opened from.
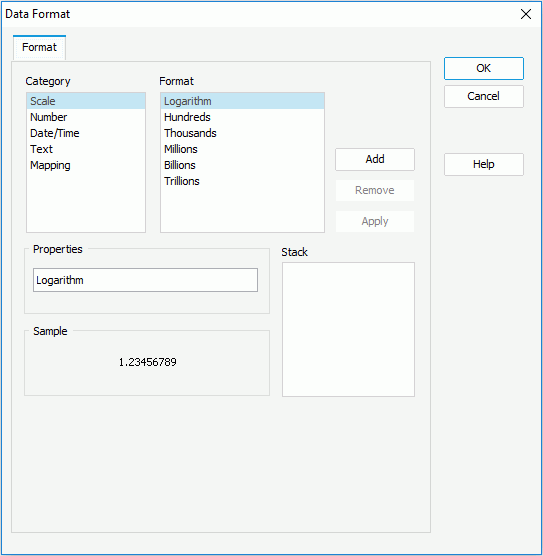
When you open the dialog to specify the data format for objects except the category axis (the X axis) in a chart, the options in the dialog are as follows. See the dialog.
To specify a format, first select a category from the Category box, then select the required format of this category from the Format box. The selected format will be displayed in the Properties text box. You can further edit the format if you want. Then, select the Add button to add the format to the Stack box. Repeat the steps to specify formats for other categories. Only one format can be defined for each category.
The following are details about options in the dialog:
Category
Specifies different formats from the following categories to display values on the chart.
- Scale
Divides the value by hundreds, thousands, and so on. - Number
Re-formats the number value (Original example: 123456). - Date/Time
Re-formats the date/time value (Example, Wednesday, December 25, 00:00:00 GMT-08:00 2002). - Text
Specifies the length for the value. - Mapping
Maps the new value to one or more values.
Format
Lists all the formats of the selected category. For details about each format, see Data Format.
Properties
Specifies the properties for the selected format.
Sample
Displays the selected format effects.
Stack
Lists all the formats that you selected from different categories.
Add
Adds a format to the Stack box.
Remove
Removes a format from the Stack box.
Apply
Applies the specified format to values on the chart.
OK
Applies the changes and closes the dialog.
Cancel
Does not retain any changes and closes the dialog.
Help
Displays the help document about this feature.
When you open the dialog by selecting  besides the Category Format text box in Data group for a chart platform to specify the data format for the category axis (the X axis) in a chart, it consists of two tabs: major label tab and minor label tab.
OK
Applies the changes and closes the dialog.
Cancel
Does not retain any changes and closes the dialog.
Help
Displays the help document about this feature.
Major Label
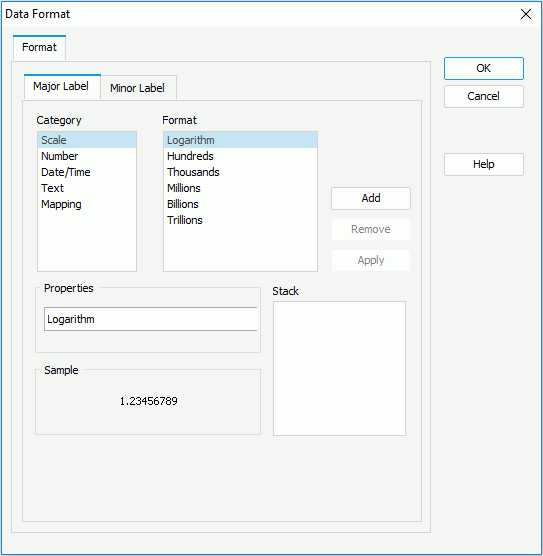
Specifies the data format of the major tick mark labels on the axis. See the tab.
To specify a format, first select a category from the Category box, then select the required format of this category from the Format box. The selected format will be displayed in the Properties text box. You can further edit the format if you want. Then, select the Add button to add the format to the Stack box. Repeat the steps to specify formats for other categories. Only one format can be defined for each category.
The following are details about options in the tab:
Category
Specifies different formats from the following categories to display values on the chart.
- Scale
Divides the value by hundreds, thousands, and so on. - Number
Re-formats the number value (Original example: 123456). - Date/Time
Re-formats the date/time value (Example, Wednesday, December 25, 00:00:00 GMT-08:00 2002). - Text
Specifies the length for the value. - Mapping
Maps the new value to one or more values.
Format
Lists all the formats of the selected category. For details about each format, see Data Format.
Properties
Specifies the properties for the selected format.
Sample
Displays the selected format effects.
Stack
Lists all the formats that you selected from different categories.
Add
Adds a format to the Stack box.
Remove
Removes a format from the Stack box.
Apply
Applies the specified format to values on the chart.
Minor Label
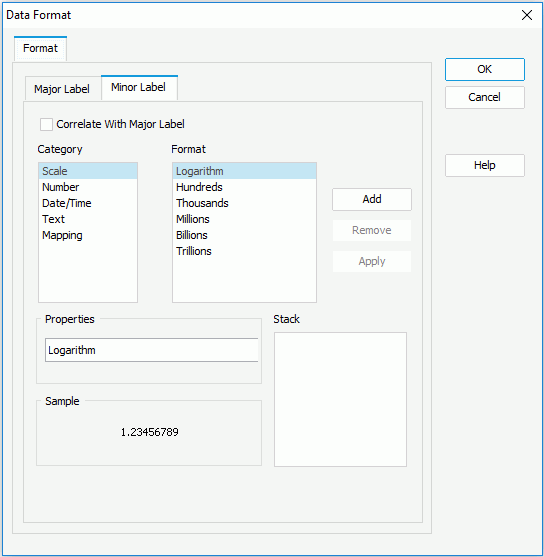
Specifies the data format of the minor tick mark labels on the axis. See the tab.
To specify a format, first select a category from the Category box, then select the required format of this category from the Format box. The selected format will be displayed in the Properties text box. You can further edit the format if you want. Then, select the Add button to add the format to the Stack box. You can also check Correlate with Major Label to specify that the data format of the minor tick mark labels correlates with that of the major tick mark labels. Repeat the steps to specify formats for other categories. Only one format can be defined for each category.
The following are details about options in the tab:
Correlate with Major Label
If checked, the data format of the minor tick mark labels will correlate with that of the major tick mark labels automatically. Only when it is unchecked can the format properties of the minor tick mark labels take effect.
Category
Specifies different formats from the following categories to display values on the chart.
- Scale
Divides the value by hundreds, thousands, and so on. - Number
Re-formats the number value (Original example: 123456). - Date/Time
Re-formats the date/time value (Example, Wednesday, December 25, 00:00:00 GMT-08:00 2002). - Text
Specifies the length for the value. - Mapping
Maps the new value to one or more values.
Format
Lists all the formats of the selected category. For details about each format, see Data Format.
Properties
Specifies the properties for the selected format.
Sample
Displays the selected format effects.
Stack
Lists all the formats that you selected from different categories.
Add
Adds a format to the Stack box.
Remove
Removes a format from the Stack box.
Apply
Applies the specified format to values on the chart.
 Previous Topic


