Ensuring two ChartCanvas always have the same dimensions

Good morning all,
Could anyone give me some tips on how to style the ChartCanvas element, so that when placed side by side they will align with each other? I've tried various techniques using both the Logi attributes and custom css to try and do this, but so far have had no luck.
Perhaps using Rows isn't a great way to layout the page - but its a bit more straight-forward than floating DIVs around (to my simple mind anyway, perhaps its a false economy in the long run?)
-

Are you just looking for the Chart Containers to align or do you want the chart Y-Axis to align?
Can you give a bit more detail on the desired results?0 -
Thanks for the reply.
I've actually resolved my issue whilst creating an .lgx that I could share easily share here.
My Issue was that I had 2 charts side-by-side in separate divs. The tops and bottoms of the chart containers were not aligned. This was actually not an issue with the chart but where I had put a text element under each chart with text explaining what the chart represented. One text string was over 2 lines, thus "squashing" the chart above it as they were contained in the same div.
Moving those into another div has resolved it.
Thanks again
Martin0 -
The only issue with using a Rows element (actually builds an HTML table) is when you need the page to behave responsively (adapting its layout based on the screen resolution or browser size)
Logi provides the Responsive Rows / Responsive Column element for this purpose. Responsive Rows is based upon a 12 column grid system. You can specify the number of grid columns each responsive column will use, at four identified resolutions (Large, Medium, Small, X-Small).
This should also eliminate the issue you had with alignment of your charts since the default Vertical Alignment for Responsive Columns is Top.
<Report ID="LogiForum.ResponsiveRows">
<Body>
<ResponsiveRow>
<ResponsiveColumn ColspanExtraSmallScreen="12" ColspanSmallScreen="6" ColspanLargeScreen="6" ColspanMediumScreen="6" Class="ThemePadding">
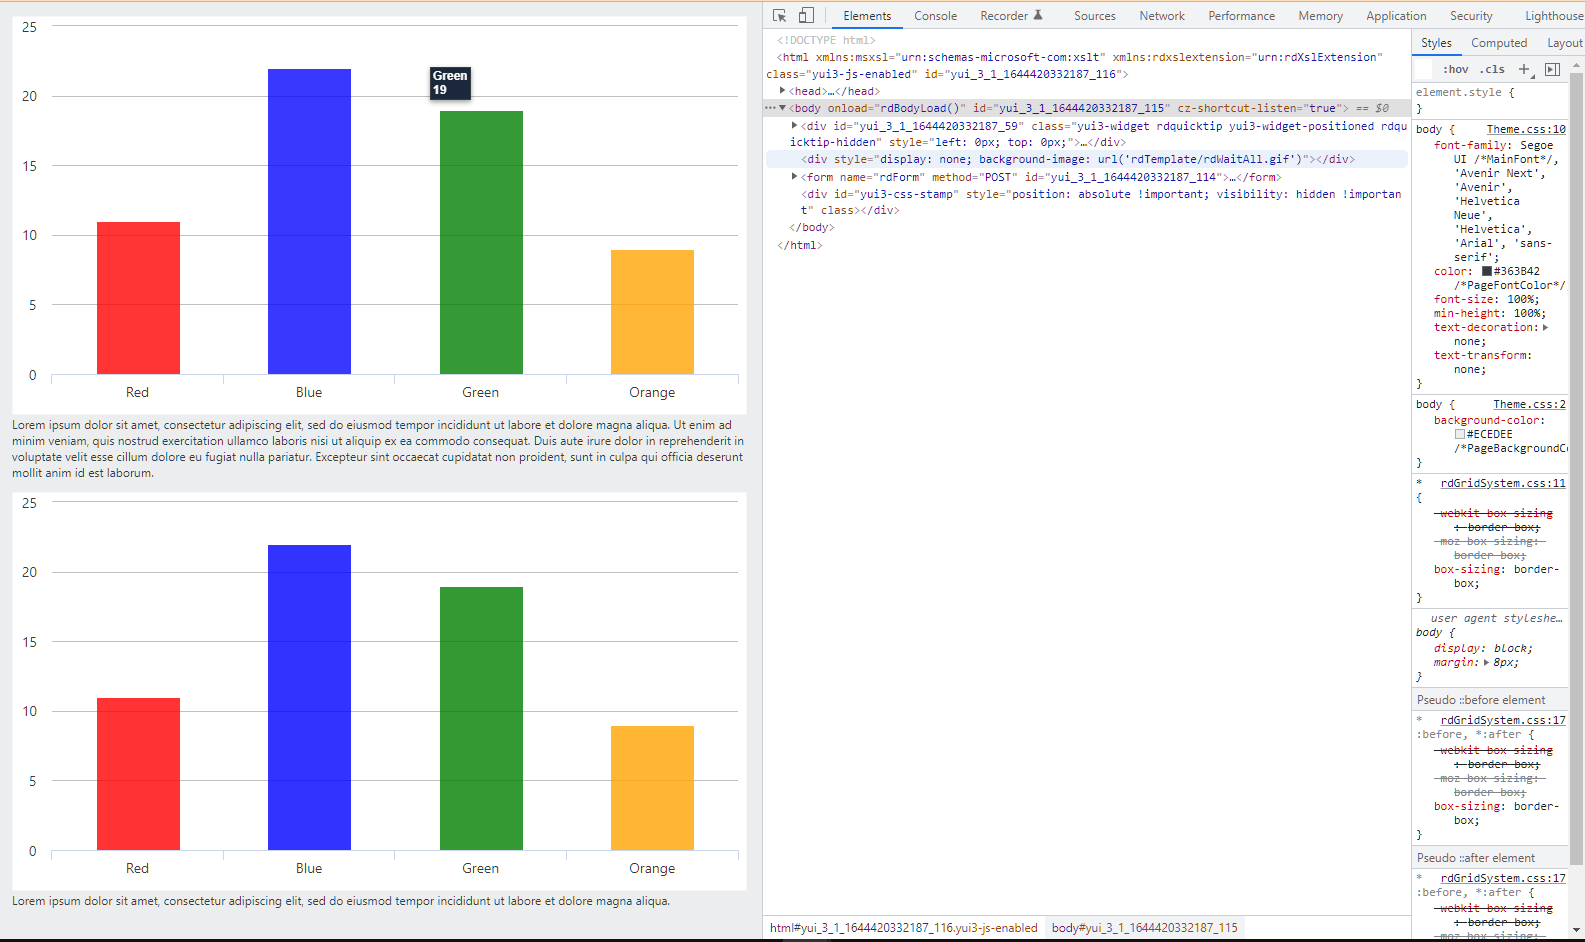
<ChartCanvas ID="chart1" ChartWidth="100%">
<Series Type="Bar" ChartYDataColumn="Value" ChartXDataColumn="Name" Color="@Chart.Name~">
<DataLayer Type="Static">
<StaticDataRow Name="Red" Value="11" />
<StaticDataRow Name="Blue" Value="22" />
<StaticDataRow Name="Green" Value="19" />
<StaticDataRow Name="Orange" Value="9" />
</DataLayer>
</Series>
</ChartCanvas>
<Label Caption="Lorem ipsum dolor sit amet, consectetur adipiscing elit, sed do eiusmod tempor incididunt ut labore et dolore magna aliqua. Ut enim ad minim veniam, quis nostrud exercitation ullamco laboris nisi ut aliquip ex ea commodo consequat. Duis aute irure dolor in reprehenderit in voluptate velit esse cillum dolore eu fugiat nulla pariatur. Excepteur sint occaecat cupidatat non proident, sunt in culpa qui officia deserunt mollit anim id est laborum." />
</ResponsiveColumn>
<ResponsiveColumn ColspanExtraSmallScreen="12" ColspanSmallScreen="6" ColspanLargeScreen="6" ColspanMediumScreen="6" Class="ThemePadding">
<ChartCanvas ID="chart1" ChartWidth="100%">
<Series Type="Bar" ChartYDataColumn="Value" ChartXDataColumn="Name" Color="@Chart.Name~">
<DataLayer Type="Static">
<StaticDataRow Name="Red" Value="11" />
<StaticDataRow Name="Blue" Value="22" />
<StaticDataRow Name="Green" Value="19" />
<StaticDataRow Name="Orange" Value="9" />
</DataLayer>
</Series>
</ChartCanvas>
<Label Caption="Lorem ipsum dolor sit amet, consectetur adipiscing elit, sed do eiusmod tempor incididunt ut labore et dolore magna aliqua. " />
</ResponsiveColumn>
</ResponsiveRow>
</Body>
<ideTestParams />
</Report>Larger Screen Sizes:

Smaller Screen Sizes:
 Hope this helps.
VISUI provides expert-level Logi training, development and contracting.0
Please sign in to leave a comment.
Comments
3 comments