ExpressView: Introduction (pre-v2021.1)
The ExpressView Designer is a data discovery tool that simplifies grouping, sorting, filtering, and aggregating data with a drag-and-drop interface. A chart can be added with a single click, and ExpressViews can be styled and saved as PDF, RTF, CSV, or Excel files.
This topic applies to the ExpressView Designer in pre-v2021.1. For v2021.1+, refer to ExpressView: Introduction (v2021.1+)

Making an ExpressView
ExpressView allows you to quickly see data and make reports without concern for the minutiae of old-fashioned report building.
To make an ExpressView:
- Click the Create New Report
 icon and select
  ExpressView.
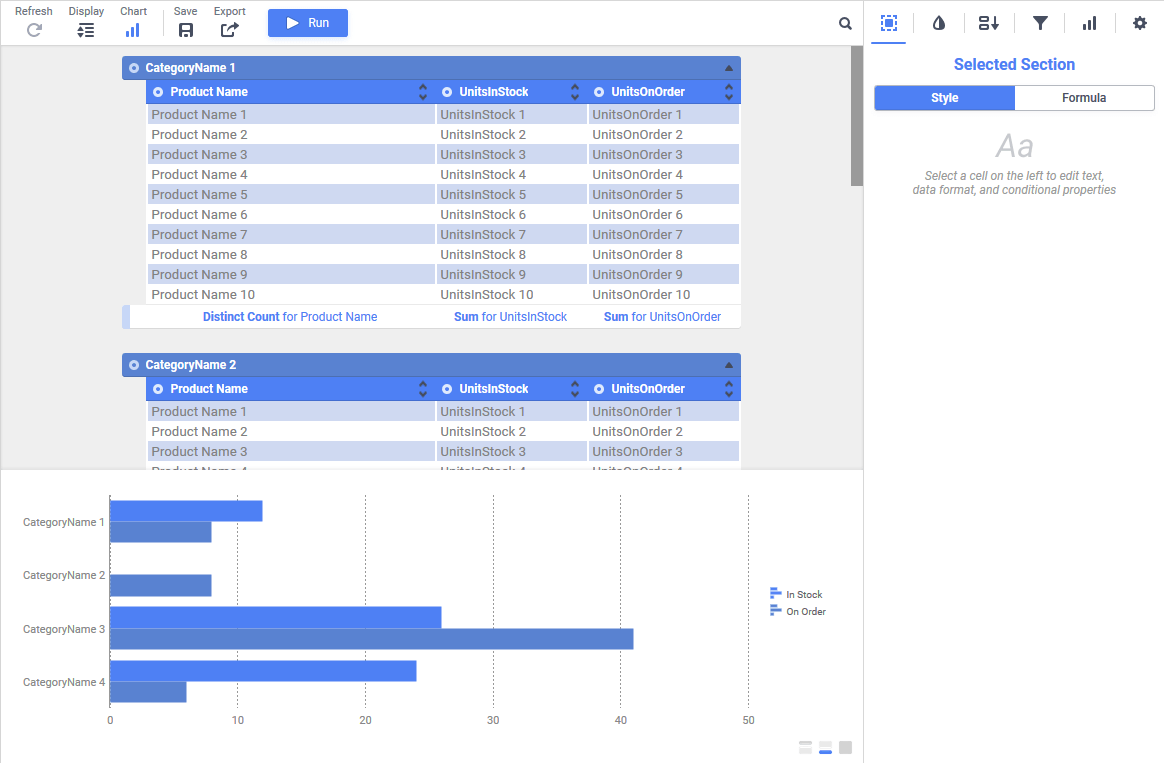
The ExpressView Designer is divided into the Data pane on the left, and the Design pane in the middle. The Data pane comprises all of the accessible data categories, containing groups of related data fields. Click the Choose Data icon to expand or collapse the Data pane.
- Expand a category by clicking the arrow
 icon. This shows the fields in that category.
 - Drag a field onto the Design pane to add it to the ExpressView. This expands the field into a data column. It will only show placeholder data initially.

Dragging a field onto the Design pane Continue to add fields as desired. Fields can be added or removed at any time.

As fields are added, unrelated fields become unavailable. To learn about how fields relate to each other, see Advanced Reports: Joins.
- When satisfied with the data selection, click
 to populate the ExpressView with data. Page through your data using the navigation icons


 in the toolbar.
Truncated results displayed
This icon and message indicates that the report has only returned a partial data set. There are fewer detail rows than the full set, and aggregate formulas and visualizations apply only to the data that was returned to the report.To retrieve more data, click the icon and select either:
- Generate +number to get the next number of data rows and add them to the existing report.
- Generate All to get the full data set.
- Click the Save
 icon to save the ExpressView. In the Settings window, enter a Name and select a folder where it should be stored. Then click Save Report Info.
These steps illustrate how quick it is to make a tabular report from scratch using ExpressView. But ExpressView can be more than just basic reports. You can make groups, charts, calculations, and customize the look of the report. And it is all designed to be easy to use. The topics in this section will describe how to use these powerful features.
To switch off the data view and revert back to design view, click  in the toolbar.
About the Radial Menu
Throughout this topic you will see references to a menu called the Radial Menu. The Radial Menu is a menu of options for each data column and group, which is accessed by clicking the colored Radial  icon on the top left of the column or group.

Each radial menu has four options, arranged in a circle around the center. When you are prompted to select a radial menu option, you will be asked to “use  radial>direction“. Direction is one of the four cardinal directions corresponding with one of the four options: left, right, up, down.
For example, “use  radial>left” means to open the radial menu and select the left option. To do this, you have two options:
- Click the radial icon, move the cursor left, then click again.
- Click-and-hold the radial icon, drag the cursor left, then release.
To close the radial menu without selecting an option, click in the center.
Interactive Editing
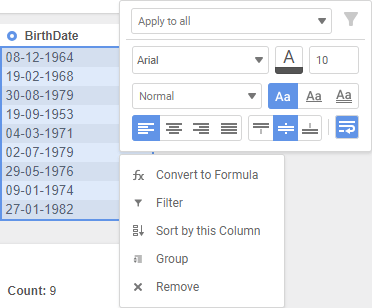
With the introduction of interactive editing to ExpressView in v2018.2, customize the report by right-clicking on the desired section while in design or live mode.

Right-click options include all of the capabilities of the radial menu, conditional filters, and formatting options such as text alignment, font type, and font color.
Conditional Selector Dropdown

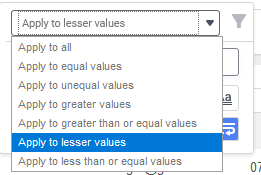
The Conditional Selector dropdown allows you to conditionally select certain values in the column you’ve right-clicked: Apply to all, Apply to equal values, Apply to unequal values, Apply to greater values, Apply to greater than or equal values, Apply to lesser values or Apply to less than or equal values. This choice will then select the applicable values in the column so changes to the formatting options will only affect them.
If the system administrator has enabled editing ExpessView with Live Data, changing the dropdown will enable the Create Filter  icon. Clicking the icon creates a filter in the Filter Pane based on the value that was right-clicked and the condition in the dropdown. For example in the figure above, right-clicking on 08-12-1964 and selecting Apply to unequal values creates a new filter on the BirthDate field with an Is Not Equal To operator and the value 08-12-1964.
aving the ExpressView will save any filters created with the Create Filter
icon but conditional formatting is cleared once Live Data is turned off. To persist conditional formatting, consider saving the ExpressView as an Advanced Report and applying conditional cell formatting instead.