Dashboard Viewer (pre-v2019.2)
This topic applies to pre-v2019.2 of the application. For current Dashboard documentation, see Dashboard Designer (v2019.2+).

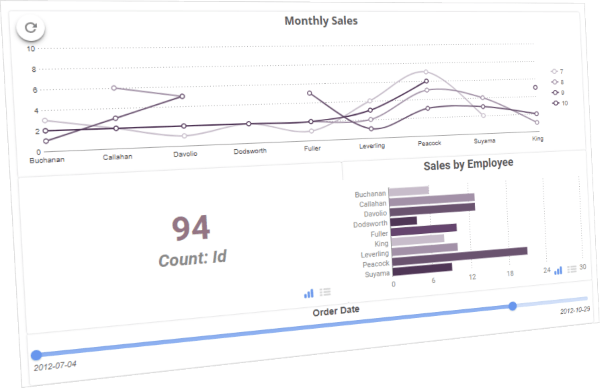
When you run a Dashboard, the output is shown in a new tab called the Dashboard Viewer. Reports and charts on the Dashboard are interactive, as are any embedded web pages. The Dashboard refreshes periodically, or you can refresh it manually. You can also filter the Dashboard with the filter sidebar or with filters on the Dashboard design itself. Basic Dashboard viewing is also supported on mobile devices.
To run a Dashboard:
- If you are in the Dashboard Designer, click Run Dashboard.

- From the Report Tree click the Run
 icon, or click the Menu
 icon and select
  Run Report.
The Dashboard Viewer opens in a new tab, indicated by the viewer  icon. This tab represents an instance of the Dashboard as you have just run it. If you go back and edit the Dashboard, you need to run it again to see the changes. This will open another viewer tab, so you can go back and close the old one.
Interacting with Dashboards
There are a number of ways to interact with Dashboards. The available options depend on how the Dashboard was designed and the type of content in it.
Reports and Visualizations
Hover over a report to show a navigation bar at the bottom of the tile. Enter text into the Find field, then click the up  or down
  icons to search for the text in the report. Page through the report by using the navigation icons


 .
.
Use the  Show Chart and
  Show Table icons to swap between chart or tabular view for an ExpressView visualization.
Click the menu icon in the top right corner for some additional view options for reports:
- Select Expand to show a report in the full screen. Select Collapse to return to the Dashboard.
- Select Refresh Report to reload the data in the report.
Click the refresh  icon to refresh all of the reports on the Dashboard.
Filtering Data
Use Dashboard filters to narrow down the data for multiple reports at once. Filter tiles can appear as scales, menus, or check boxes on the Dashboard. Select one or more data values, or a range of data, to apply the filter to all its connected reports. This will automatically refresh the reports.
If there is a filters  icon then there are more filters available. Click the icon to open the filters pane and choose values for the filters.
If there is a parameters  icon then there are parameters available, which are a special type of filter. Click the icon to open the parameters pane and choose values for the parameters.