Applying the Crosstab Filter to a Chart
The following example illustrates how the Crosstab Filter can be used with a chart:
- In a departure from general practice, when you use a static chart with a Crosstab Filter, you do not need to specify the chart's normally-required Data Column Y-axis attribute value. Instead, leave it blank.
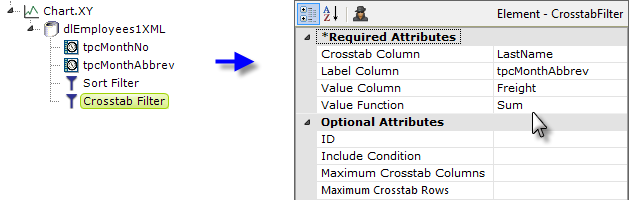
- As shown above, an Crosstab Filter element is added as a child beneath a datalayer element for a Bar Chart.
- Its Crosstab Column attribute value specifies the datalayer column used to create the chart's bars: each distinct value in this column will create a new bar in the chart.
- The Label Column attribute specifies the column that provides label text along the X-axis, beneath the bars. In this example, we've applied a Time Period Column element to the OrderDate data to produce abbreviations for the names of months.
- The Value Column attribute specifies the column that provides the chart's Y-axis values.
- The Value Function attribute specifies how Y-axis values are calculated; in this example we're summing the data for each employee.
- In order to create the right monthly order in the X-axis, we've also applied a second Time Period Column element to the OrderDate data to produce just the month number and then we've sorted the datalayer on those month numbers using a Sort Filter, before applying the Crosstab Filter.
This relatively simple element configuration produces a nice bar chart:
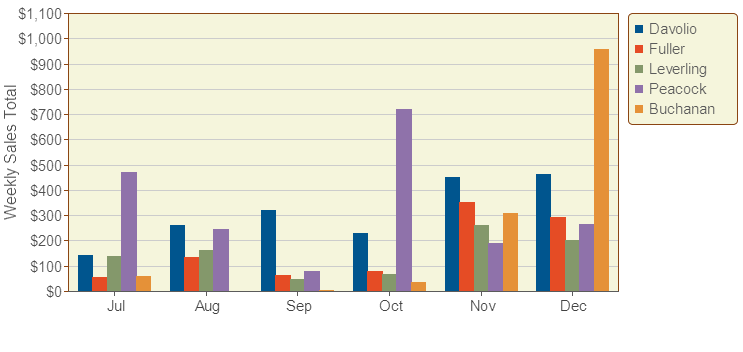
Adding a Legend element to the chart products a list of the values from the Crosstab Filter element's Crosstab Column attribute.
Here are two different chart styles, Line and Area, created using almost the same technique as the chart above:
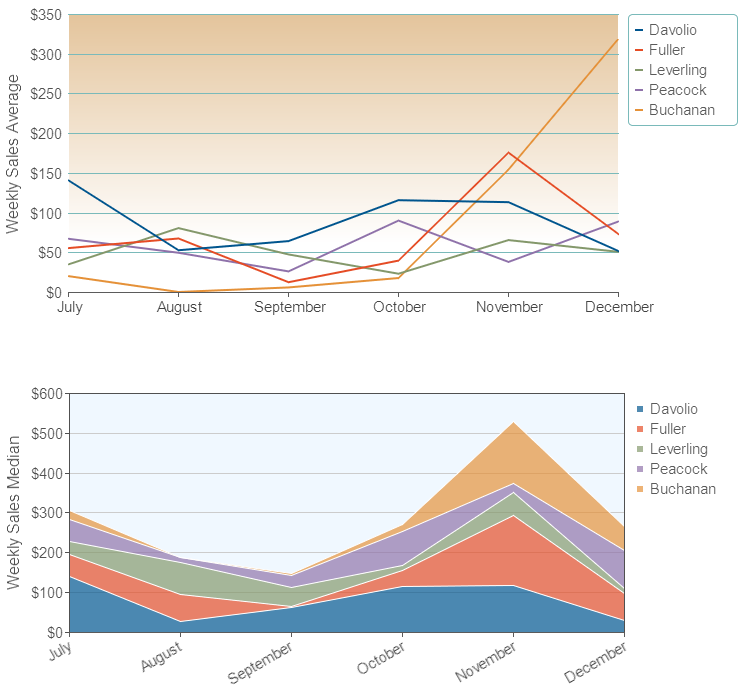
The difference in these charts is that Crosstab Filter element's Value Function attribute has been set to Average and Median, respectively, rather than to Sum, and there are some cosmetic configuration differences in their X-axis labels and legends.
 While the element rules in Studio will allow you to add child elements beneath the Crosstab Filter, such as the Extra Crosstab Value Column element, they will be ignored when the filter is being used with charts.