Attaching Your Debugger Trace Report
The Debugger Trace Report provides detailed information about the execution of your Logi Info application and you can learn about this feature in Debug Reports. A Logi Support Engineer may ask you to attach it to your case.

Do not attach a screenshot of your debugger report page. It's easy to do but doesn't really help the engineer. Once your application is configured for debugging, use these steps to compress the debugger information and attach it to the case.
The case attachment size limit is 25MB. You may need to temporarily reduce the size of your data, through filtering or by setting the datalayer Maximum Rows attribute, if you believe the data, plus your report and debug pages (which are relatively small in any case), will exceed this limit.
Logi Info v12.5+ : Gathering Debug Information
With debugging turned on, you can view your report's (or chart's) debugger report page by clicking the debug icon:
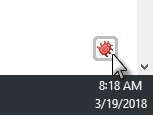
For a report, the icon appears in the lower right-hand corner of the browser page. Each chart will have its own debug icon next to it and, if relevant, must be included individually.
You should also be aware that some operations, such as AJAX refreshes, scripting, or concurrently operating datalayer threads in a dashboard, will generate their own secondary debugger reports.
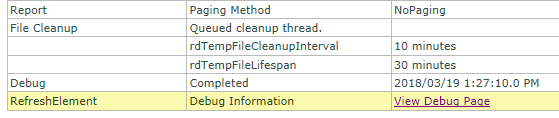
Links to these secondary pages look like the example shown above. Be sure you're attaching the correct debugger report page!
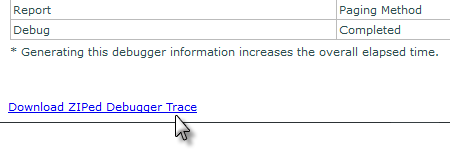
Once the debugger report is displayed, the link shown above appears in the bottom left-hand corner of the page. Click it to automatically gather, compress, and save the debug details to a .zip file. The suggested file name will include a really long random string; please rename it to something short and meaningful before saving it. Skip the next sub-section of instructions and go to the "Attaching the .Zip File" section.
Earlier Logi Info Versions: Gathering Debug Information
Earlier Info versions do not have a special link on the debugger report for compressing and downloading debug details, so you'll have to manually gather the relevant files and compress them into a file. Create an empty folder for collecting the files, then use these steps:
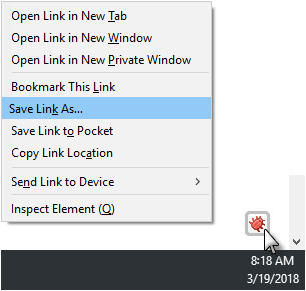
- For a report, the debug icon appears in the lower right-hand corner of the browser page. Each chart will have its own debug icon and, if relevant, must be included individually. Right-click the debug icon, as shown above, select the Save Link As... or Save Target As... option (varies by browser) and save the file to your empty folder.
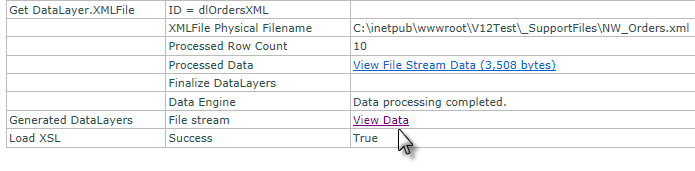
- Left-click the icon to open the debugger report page and find the View Data link for the relevant data, as shown above.
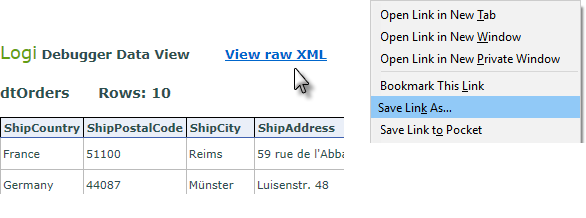
Depending on your Logi Info version, when you click the View Data link you may see a formatted table of data, as shown above. Right-click the View raw XML link and select Save Link As... or Save Target As... (varies by browser) and save the data file to your folder.
If you don't see the formatted table, then use your browser's Back arrow to go back to the debugger report, right-click the View Data link, and use the same technique to save the data file to your folder. - Repeat Step 2 as necessary to collect all of the relevant data.
- Use the OS tools or a 3rd-party tool like WinZip to compress the folder and its contents into a single .zip file.
Attaching the .Zip File
Once you've produced your .zip file, you're ready to attach it to the case. Go to the Support Portal, locate the case and browse its details.
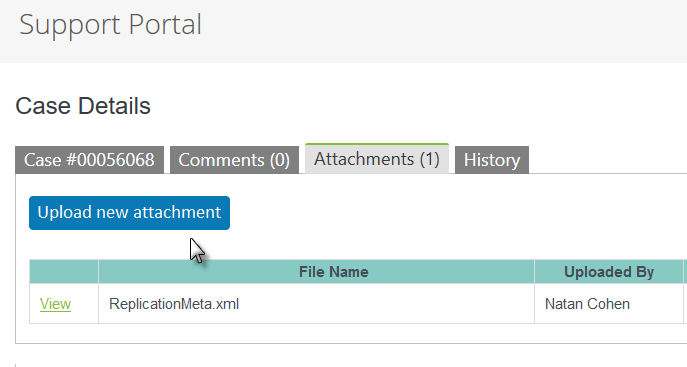
Click the Attachments tab, as shown above, and click Upload new attachment to select and upload your .zip file. Once uploaded, it will appear in the list of attachments.
Attaching Scheduler Debug Logs
The Logi Scheduler is a background service that can be used to run scheduled events. It logs its activities and can be configured to include several levels of information in its log, including very detailed debug details. See the Scheduler's Settings File section of Logi Scheduler to learn how to set logging to include debug information.
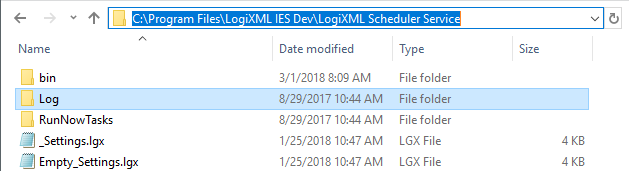
The Logi Scheduler Service for .NET logs operational information to .xml files in (if default installation location was used):
C:\Program Files\LogiXML IES Dev\LogiXML Scheduler Service\Log as shown above.
Find the log file for the relevant time period and attach it to your case, or copy it into a folder with other debug information to be compressed and attached.
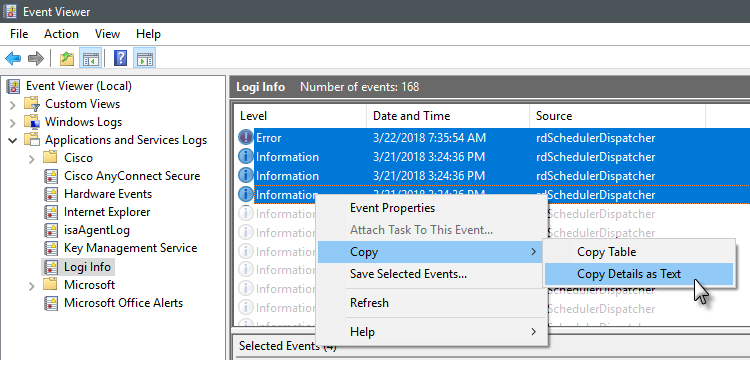
In addition, the Scheduler will log events in the Windows Event Log, which can be seen in the Event Viewer tool. You can select one or more events and copy them, with their details, by right-clicking them as shown above. Paste the copied text into a text file and include it with your debug and log files. The Logi Scheduler Service for Java logs operational information to <installFolder>/Log/LogiScheduler.log, where installFolder is the folder chosen when the Scheduler was deployed. Relevant log files can be attached to the case or copied into a folder with other debug information to be compressed and attached. Attach the files to your support case in the Support Portal using the same technique described earlier.