Lesson 1: Creating a Web Report Using the Quick Start Method
In this lesson, we create a web report using the quick start method and learn about the visualization toolbar of Web Report Studio, which is also available when you use the traditional method.
This lesson contains the following tasks:
Task 1: Create a Web Report
- In the Start Page of the Server Console, select Web Report in the Create category.
Server displays Web Report Studio in a new tab and prompts you to select data for the new report.
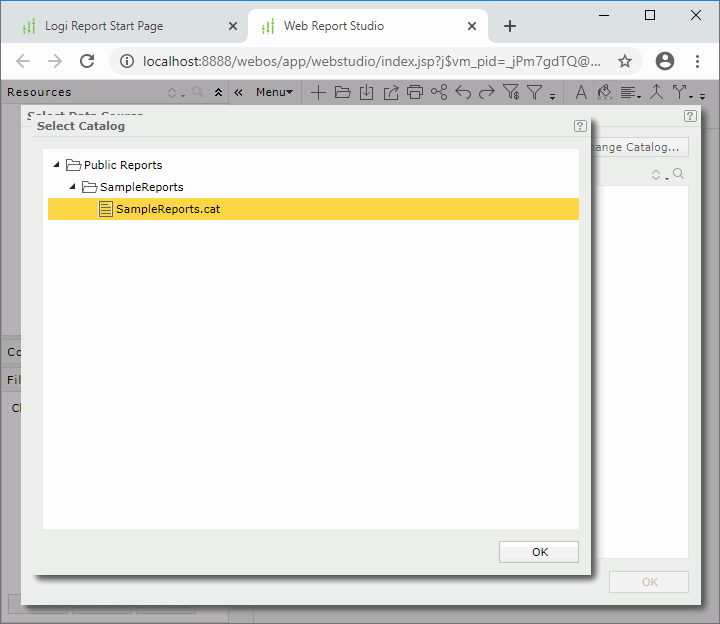
- In the Select Catalog dialog box, expand the SampleReports folder, select the SampleReports.cat catalog and select OK.
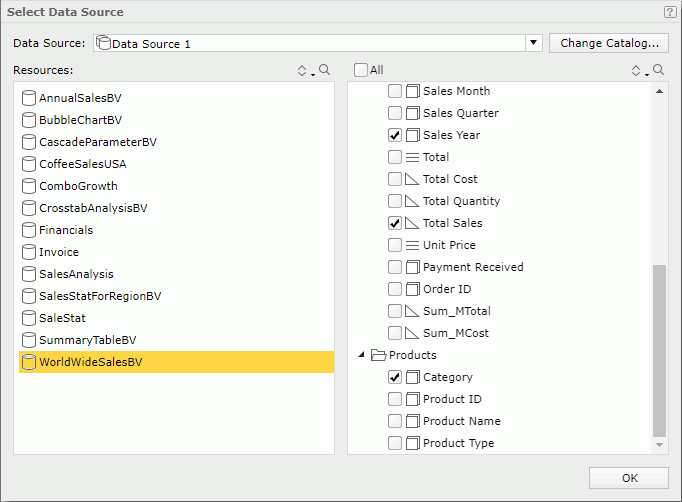
- In the Select Data Source dialog box, select WorldWideSalesBV in the Resources box, Web Report Studio then displays all the elements in the business view in the right box. Select the following view elements: Region, Sales Year, Total Sales, and Category, then select OK.
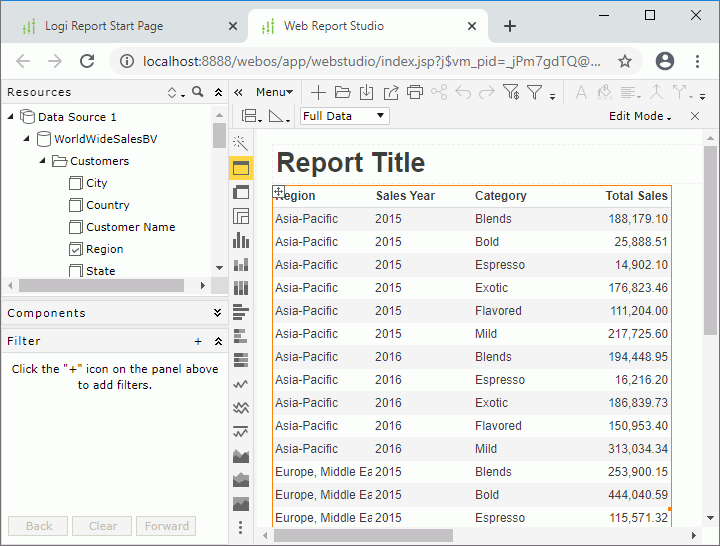
Web Report Studio creates a web report containing a table.
Task 2: Work with the Visualization Toolbar
Via the visualization toolbar (the toolbar displayed vertically) of Web Report Studio, you can conveniently convert a data component between the following types: table, crosstab, or chart.
First, we convert the table to a crosstab.
- Select Convert or drag to add Crosstab
 on the visualization toolbar. Web Report Studio converts the table to a crosstab.
The visualization toolbar also provides entry to the wizard of current data component. With the wizard, you can redefine a data component, and apply filter to narrow down data in the component.
Next, we use the wizard to edit the data fields in the crosstab.
- Select Crosstab Wizard
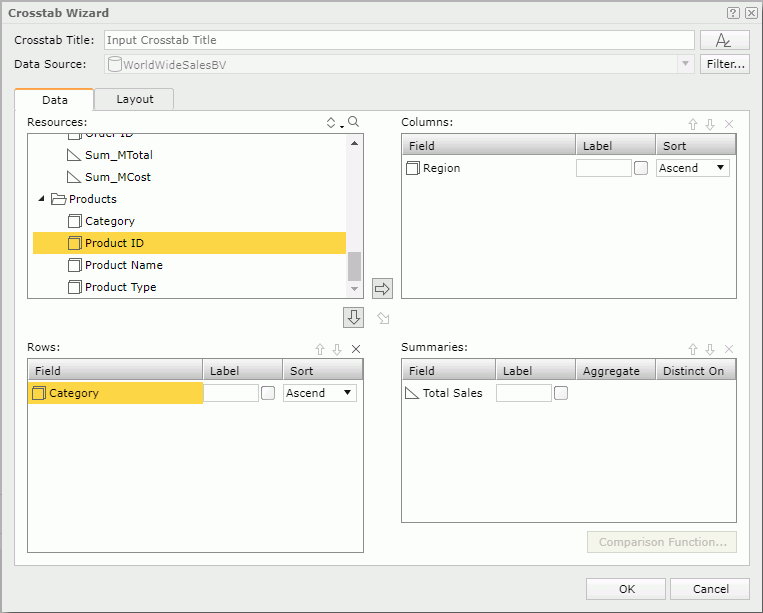
 on the visualization toolbar. Web Report Studio displays the Crosstab Wizard dialog box.
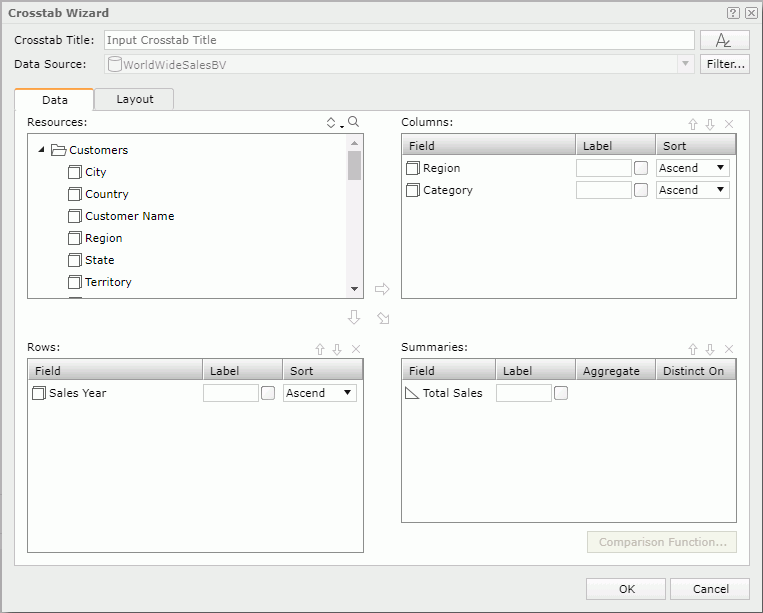
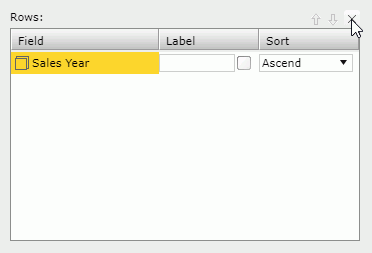
- In the Rows box of the Data tab, select Sales Year and then select RemoveX at the top right of the box to remove it.
- Remove Category from the Columns box in the same way.
- In the Resources box, select Category and select Add
 to add it to the Rows box.
- Select OK to confirm the changes. Web Report Studio displays a message dialog box, asking for your confirmation of the change. Select OK in the dialog box.
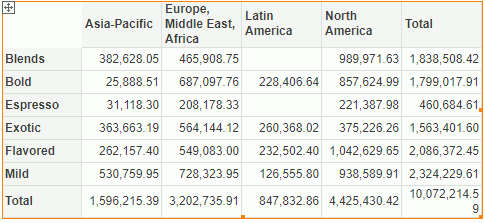
Web Report Studio creates a new crosstab.
Lastly, we convert the crosstab to a chart and save the web report.
- Select Convert or drag to add Bar
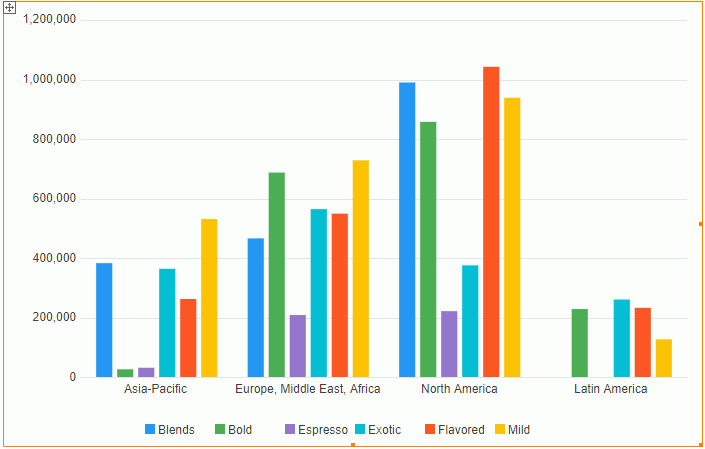
 on the visualization toolbar. Web Report Studio converts the crosstab to a bar chart. You can also select other chart types on the toolbar.
- Select Save
 on the toolbar. Web Report Studio displays .
 - In the Save As dialog box, select the My Reports folder from the Save In drop-down list, type Product Sales in the File Name text box, then select OK to save the report to the server resource tree.
 Previous Topic