Lesson 2: Creating a Horizontal Banded Report
Your new reporting assignment is to create a summary of each Jinfonet Gourmet Java employee. The report will also need to communicate the ranking of the employee's salary, that is, whether it is on the upper or lower end, or somewhere in between, relative to all employees. The following prototype of the report has been given to you:
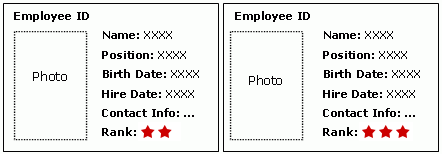
Follow the tasks below to finish creating the report:
- Task 1: Create the Initial Report
- Task 2: Adjust the Report Layout and Add the Photo DBField
- Task 3: Rank the Employees
- Task 4: Fine Tune the Report Layout
Task 1: Create the Initial Report
Again the report has repeated rows of information, but this time they are repeated left to right instead of top down. A horizontal banded report is offered to support this format.
To create the initial report with a horizontal banded object, follow these steps:
- In Designer, select File > New > Page Report.
- In the Select Component for Page Report dialog box, select Horizontal Banded, then select OK.
Be sure that JinfonetGourmetJava.cat is specified as the current catalog because it is the catalog we use in this track. For information about specifying this catalog, see Task 1, Step 2 and 3 of Lesson 1.
- In the Data screen of the Horizontal Banded Wizard dialog box, select <New Query...> in the Queries node of Data Source 1, type EmployeeInformation in the Enter Query Name dialog box and select OK.
- In the Add Tables/Views/Queries dialog box, expand the JDBC connection node and then the Tables node, then select the table Account Managers and select
 to add it to the query. Select OK to close the dialog box.
 - In the Query Editor dialog box, select * in the Account Managers table to add all the columns in it to the query and then select OK to create the query.
- Select Next in the Horizontal Banded Wizard dialog box to go to the Display screen.
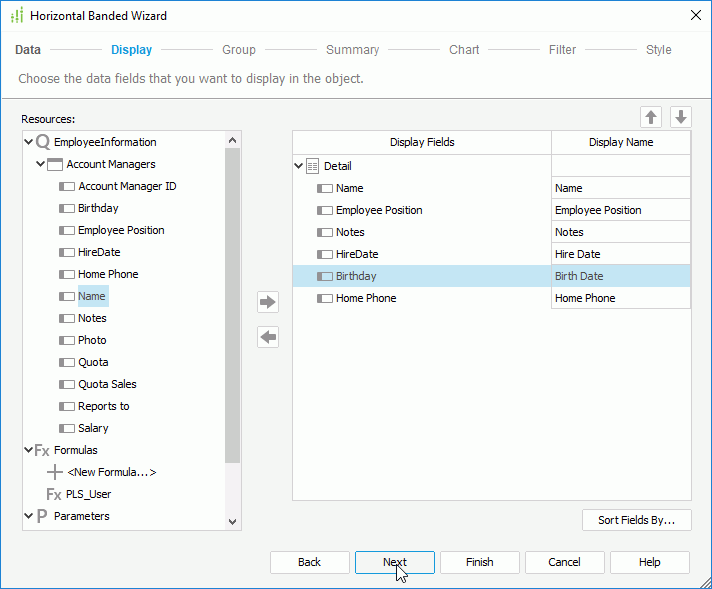
- From the Resources box, select the following DBFields in the Account Managers table and select
 to add them to the right-hand box one by one: Name, Employee Position, Notes, HireDate, Birthday and Home Phone, edit the display names HireDate and Birthday to Hire Date and Birth Date, then select Next.
- In the Group screen, select Account Manager ID and select
 to add it as the group-by field.
 - Select Style to switch to the screen and select Simple as the report style. Select Finish to create the report. Designer displays the report as follows:
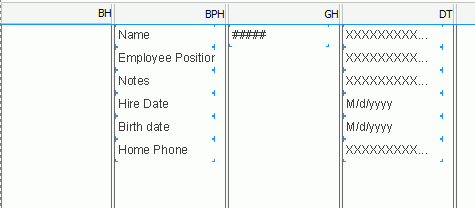
The panels in the banded object are identified on the top by their abbreviations: a banded header panel (BH), a banded page header panel (BPH), a group header panel (GH), a detail panel (DT), a group footer panel (GF), a banded page footer panel (BPF), and a banded footer panel (BF).
Task 2: Adjust the Report Layout and Add the Photo DBField
To improve the appearance of the report, we will do some adjustments to the report's layout. In addition, we will add the Photo field to the report which enables the report to be used to identify the employee.
- Widen the DT panel, then resize the Employee Position and Notes DBFields horizontally so that the data won't get truncated.
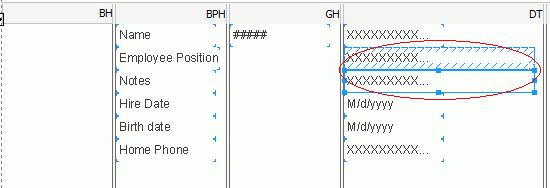
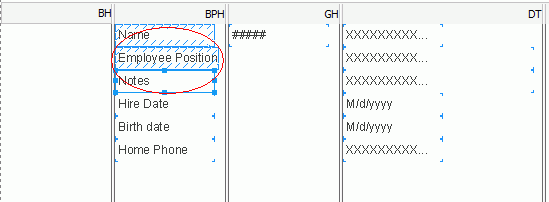
- Select the Name, Employee Position and Notes labels in the BPH panel by holding the Ctrl key on the keyboard and press the Delete button on the keyboard to remove them from the report.
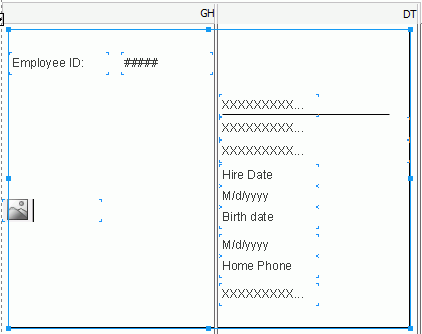
- Adjust the space between fields in the DT panel, move the Hire Date, Birth Date, and Home Phone name labels from the BPH panel to the DT panel and place them above their fields as follows:
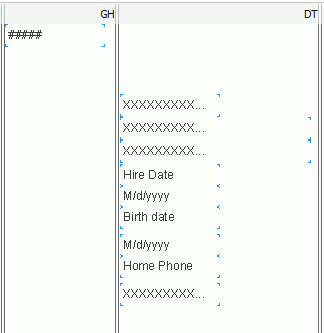
- Hide the BH, BPH, GF, BPF and BF panels that don't hold any data by right-clicking the panel and select Hide from the shortcut menu.
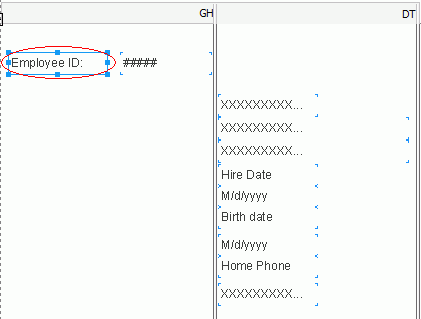
- Resize the GH panel, select Insert > Label to add a label before the group-by field in the panel, edit its text as "Employee ID:", resize the group-by field and the label, and adjust the position like the following:
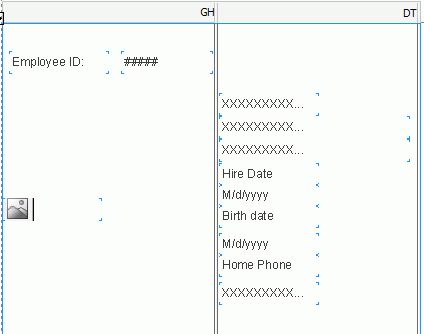
- From the Data panel, drag the Photo DBField in the Account Managers table to the GH panel.
- Remove the name label of the Photo DBField by right-clicking it and selecting Delete from the shortcut menu, then resize the field as follows:
- Select Insert > Drawing Object > Line to insert a line object below the first field in the DT panel, and insert a box object in the same way to enclose all the objects in the reports.
Task 3: Rank the Employees
As required at the beginning of the report design, the manager wants to rank the employees by their salaries, so we will add a rank object to the report.
- Select the DT panel of the report and select Insert > Rank to display the Rank Expert dialog box.
- In the Rank Expert dialog box, first select Salary from the Rank Resources box.
- Select the Browse button, choose Rank5.gif in the JinfonetGourmetJava folder and select Open to select it as the default image for all value ranges.
- In the Value Range box, type 40000 in the Minimum cell, 49999 in the Maximum cell, then select in the Image cell and select <Browse...> to choose Rank3.gif as the image of this range.
- Select
 twice to add two ranges and define them as follows:
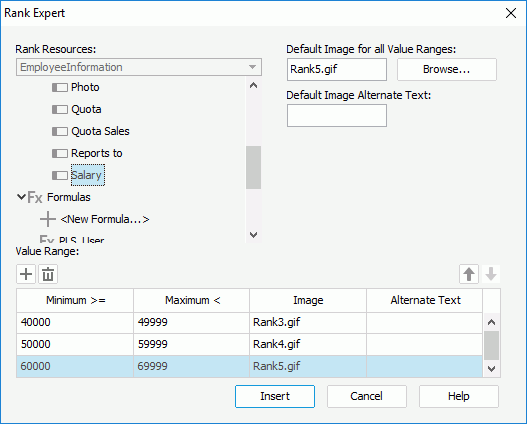
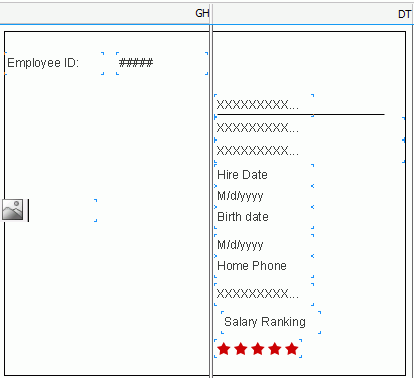
- Select the Insert button to insert the rank to the DT panel, below the Home Phone field.
- Move the name label Salary of the rank from the bottom of GH panel and place it above the rank, then edit its text to Salary Ranking and resize the label to full display the text.
Task 4: Fine Tune the Report Layout
- Select the Employee ID label and the group-by field in the GH panel by holding the Ctrl key on the keyboard, then select 10 from the Format > Font Size drop-down list
 .
. - Hold the Ctrl key on the keyboard and select the Salary Ranking label and the rank in the DT panel, then select Format > Left
 so as to make them aligned the same with other objects in the DT panel.
 - Select the first field in the DT panel (the Name DBField), change its properties in the Report Inspector as follows, then resize it to make sure the names can be fully displayed.
- Font Size: 12
- Bold: true
- Foreground: 0xcc0000
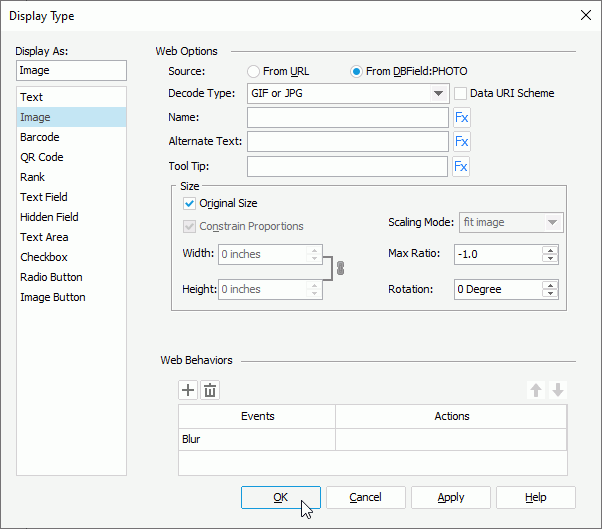
- Right-click the Photo DBField in the GH panel and select Display Type from the shortcut menu.
- In the Display Type dialog box, select Image in the Display As box, choose GIF or JPG from the Decode Type drop-down list, then select OK.
- In the Report Inspector, select the Line node in the report structure tree and change its Line Color property to Lightgray, Line Thickness to 0.02.
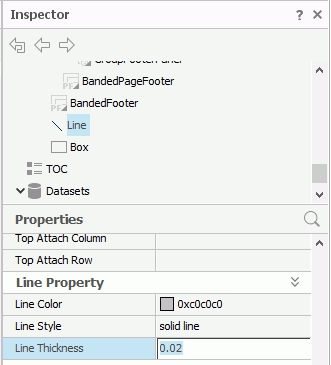
- Select the Box node and change its Border Color property to Lightgray too.
Next, we will add a title to the report to the page header panel of the report.
- Select View > Page Header to display the page header.
- In the Report Inspector, select the Page Header Panel node and change its Height property to 0.6.
- Drag
 from the Basic group in the Components panel and drop it in the page header panel.
 - Resize the label, double-click it to modify its text as Employee Information List, then in the Report Inspector, change its Font Size to 14, and Foreground to 0xcc0000.
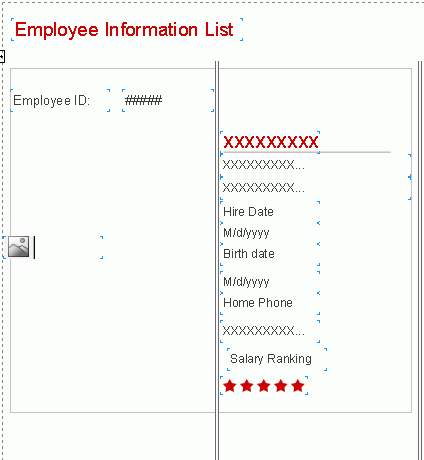
After editing, the report looks somewhat like below in design view:
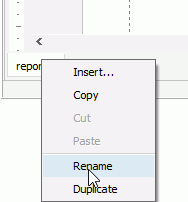
- On the report tab bar, right-click the report tab and select Rename to rename it to EmployeeDetails.
- Select File > Save to save the report as EmployeeInformation.cls.
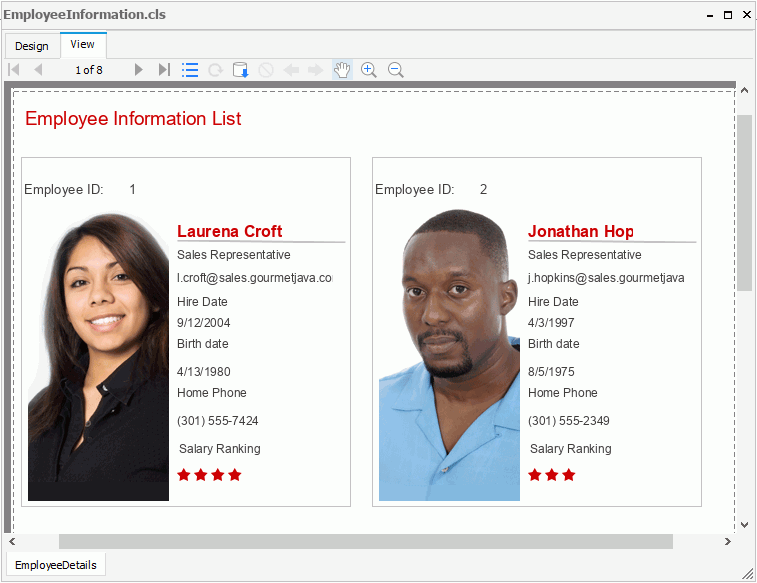
- Select the View tab to preview the report. Designer displays the report similar to the below one:
 If the report does not look correct, you can compare it to the final version of the report included in Designer. To do this, save and close your current catalog, and then open the JinfonetGourmetJava.cat catalog file located at
 <install_root>\Demo\Reports\TutorialReports.
 Previous Topic