Using View Elements
You can use the Resource View panel to analyze data of a report by dragging view elements from the panel to the components (banded object, table or crosstab) in the report. The Resource View panel provides a business-oriented view of databases. This view shields end users from having to understand database connectivity and SQL syntax while allowing IT professionals to maintain control of business data and to ensure its integrity. Using the Resource View panel, Page Report Studio dynamically builds SQL statements to retrieve data and automatically generate multidimensional data views. These views contain the underlying data structure which makes data analysis possible. However for page reports that are created on queries in Logi JReport Designer, if you want to use this feature on them, the data fields used by the reports should be able to be converted to corresponding view elements.
A Logi JReport Live license for Logi JReport Server is required in order to use this feature. If you do not have the license, contact your Jinfonet Software account manager to obtain it.
The following examples show how to analyze reports using view elements. These examples are based on the business view WorldWideSalesBV in Data Source 1 of the SampleReports catalog.
Tip: To display the Resource View panel, select Menu > View > Resource View or the Resource View button  on the toolbar. You can use the search bar at the top of the panel to search for any desired resource in a fast and convenient way.
Below is a list of the sections covered in this topic:
- Example 1: Analyzing a Banded Report
- Example 2: Analyzing a Crosstab Report
- Example 3: Analyzing a Table Report
Example 1: Analyzing a Banded Report
- In Page Report Studio, design a banded report titled Sales in China on WorldWideSalesBV, which shows the fields Product ID, Country, Product Name, Unit Price, Quantity, and Discount, and applies the ClassicBlue style.
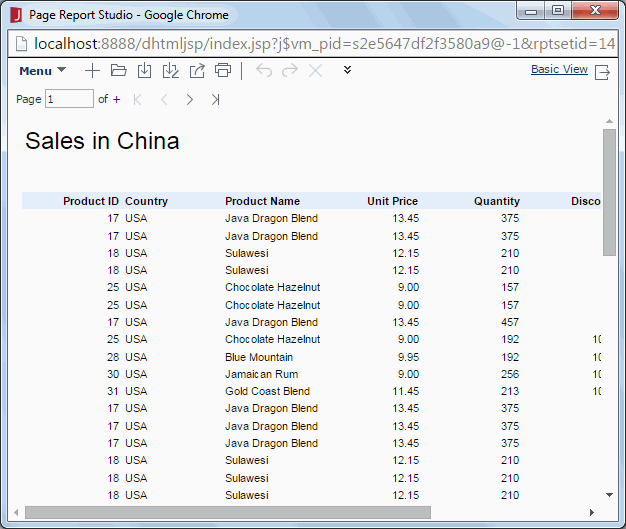
First, we will apply a filter to the banded object to narrow down data scope.
- Select the Filter button
 on the toolbar. In the Filter dialog, define the filter as COUNTRY = 'China'.
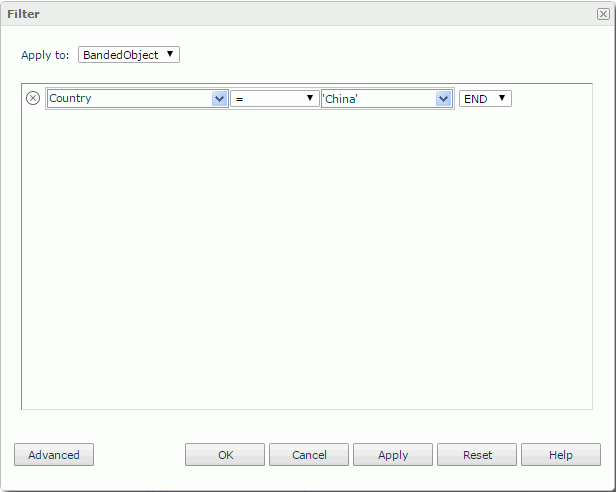
We want to further sort the banded object by Product Name ascending.
- Right-select any of the Product Name values and select Sort > Ascend from the shortcut menu.
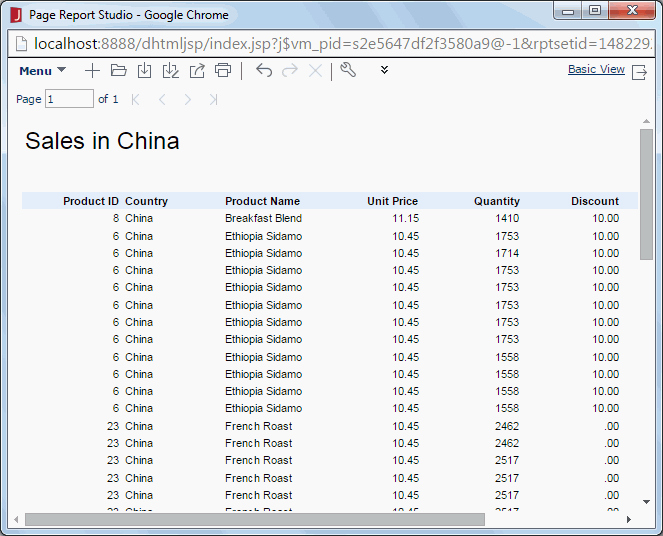
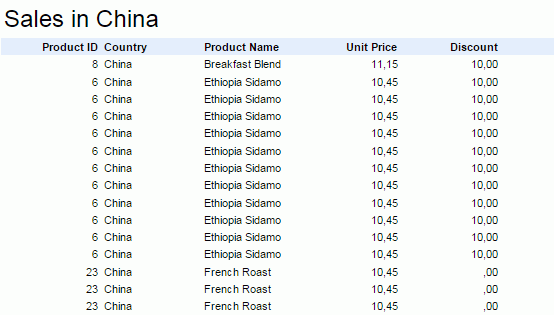
- As the banded header panel holds no data, we can hide it by right-clicking it and selecting Hide from the shortcut menu.
Now the report shows as follows:
Next, we will add the Total field to the banded object and group by the City field.
- Select the Resource View button
 on the toolbar, then resources of the business view the banded object uses will be shown in the panel.
 - From the Resource View panel, drag the detail object Total in the Orders Detail category to the detail panel of the banded object.

- Drag the group object City in the Customers category to the banded page header panel, when a blue line appears, release the mouse button.

- Finally, drag the aggregation object Total Sales in the Orders Detail category to the group footer panel.
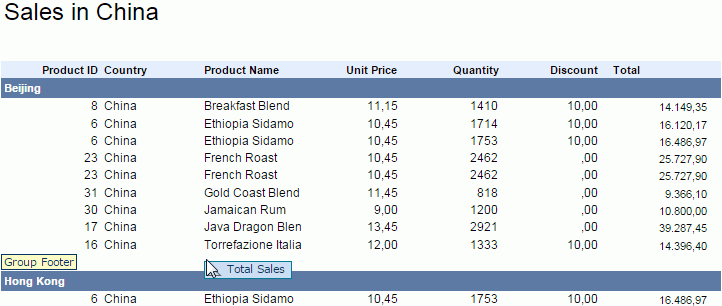
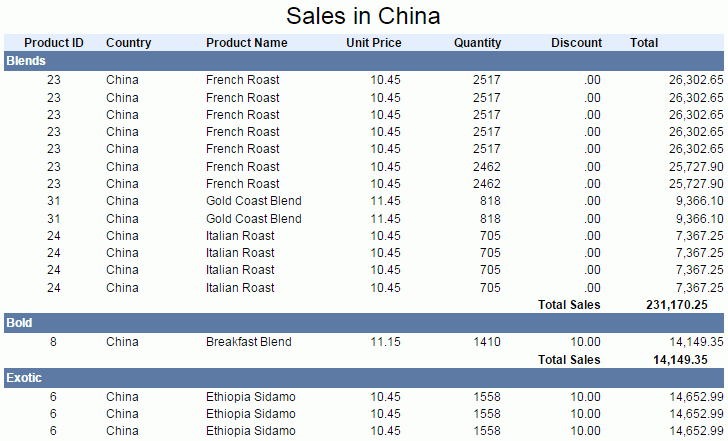
- We can now analyze the data in various ways. For example, if we want to see the sales by category instead of city, right-click on any of the City fields and select Drill To > Category from the shortcut menu, then we can see the same report with an entirely different view of the data.
Example 2: Analyzing a Crosstab Report
- Design a crosstab report on WorldWideSalesBV showing product sales information with Product Type (Ascend) as the column field, Category (Ascend) as the row field, and Total Cost as the aggregate field. Apply the ClassicBlue style to the crosstab.
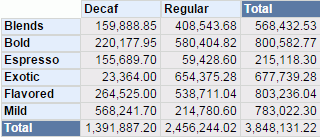
First, we want to replace the product type information with region information, and display the total sales of each product category in each region.
- Remove Product Type from the crosstab by pointing to the header Product Type (Decaf or Regular), then dragging it outside the report page. A message box will prompt you whether or not to remove the field. Select OK to confirm, and we can see that the crosstab no longer contains the Product Type information.
- Select the Resource View button
 on the toolbar, then resources of the business view the crosstab uses will be shown in the panel.
 - Drag the group object Region in the Customers category from the Resource View panel to the crosstab until a blue line appears indicating the level of the group.
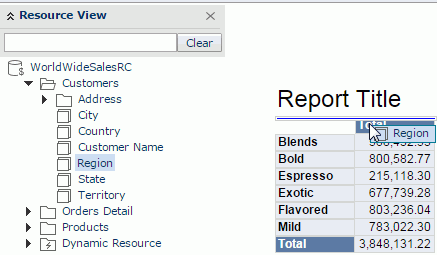
- Drag the aggregation object Total Sales in the Orders Detail category to the aggregate area of the crosstab.

Now the total sales of each product category in each region is displayed.
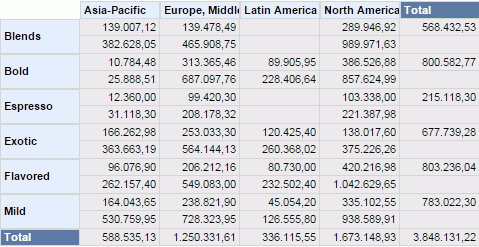
- Then we would like to see the country information for the Europe, Middle East, Africa region. Select in the Europe, Middle East, Africa header and we will drill down to the next lower level based on the hierarchy defined in the business view which in this case is Country.
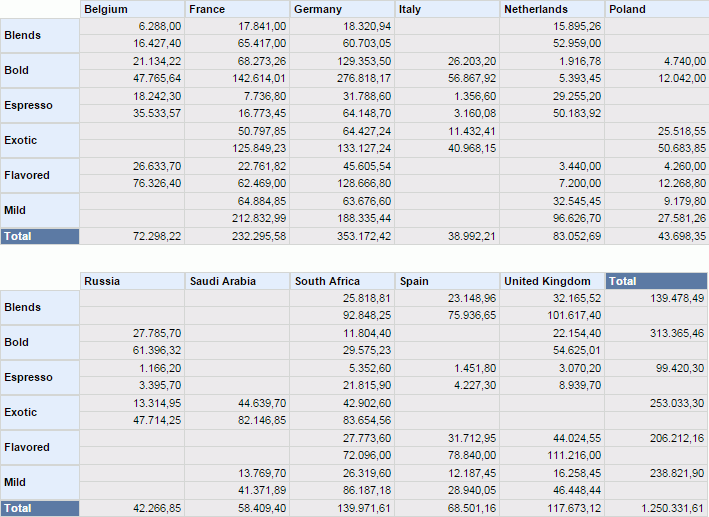
Using the same way, we can further drill down to the State, then the City levels which have been defined in the hierarchy to get detailed sales information in each city. For more details about drilling, refer to Automatic Drilling.
Example 3: Analyzing a Table Report
For a table, you can analyze its data in the same way as for a banded object. Furthermore, Page Report Studio provides some analysis methods specific for tables.
- Design a table report on WorldWideSalesBV, which shows the fields Product Type, Country, Product Name, Unit Price, Quantity and Discount, and applies the ClassicBlue style.
- Add a filter COUNTRY = 'China' AND PRODUCT TYPE = 'Decaf' to the table (see Example 1 for details on filtering). The table displays as follows:
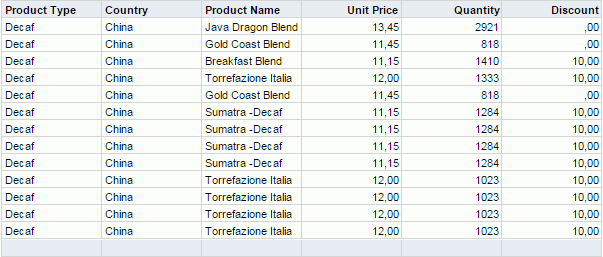
For a table, we can insert a column (or row for horizontal table) at a specific position. So next, we will insert the group object City into the table.
- Select the Resource View button
 on the toolbar, then resources of the business view the table uses will be shown in the panel.
 - Drag City in the Customers category from the Resource View panel to the boundary between the first column (Product Type) and the second column (Country) in the table until a blue line appears. Release the mouse button and a message will prompt you whether or not to insert the group field, select OK
to confirm.
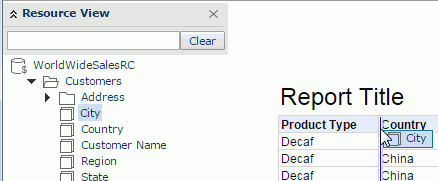
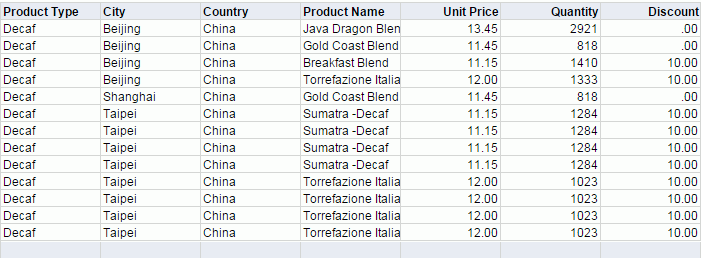
The report result will be regenerated.
Tip: When you add a column to a table, if the width of the table exceeds the defined page size, you will be prompted whether to allow Logi JReport to adjust the page size automatically so as to place the column. Select Yes in the message box to have the page size adjusted, or No to make the columns in the table compressed. Also, If you do not want to display the message in future, check Don't prompt the message again in the message box, or uncheck Always Prompt Whether to Adjust Page Size Automatically in the Profile > Customize Profile > Page Report Studio > Properties > Default tab. If you choose not to show the message box again, when the table width exceeds the defined page size, Logi JReport will always adjust the page size automatically.
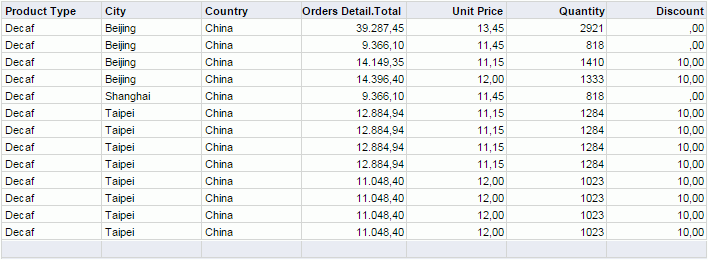
Next, we want to show the total information and remove the product name information. This can be done with a single drag-and-drop.
- Drag the detail object Total in the Orders Detail category to the header Product Name until the label Product Name is highlighted in a blue background.

Now, the total value for each record will be generated.
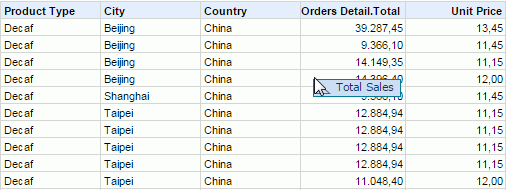
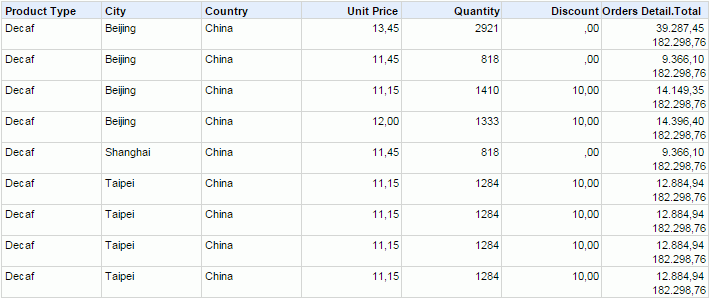
As a table column can contain more than one field, next, we will add the aggregation object Total Sales to the Total column.
- Drag Total Sales from the Resource View panel to any value in the Total column.
The report result will be regenerated.
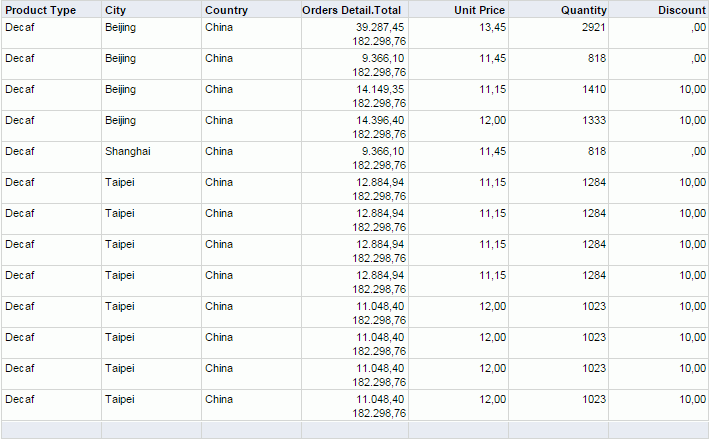
Here 182,298.76 is the sum of all total values. In this way, the title for the added field will not be automatically created.
At last, we want to change the order of the Total and Discount columns in the table.
- Drag the label Total to the right of the Discount column, when a blue line appears along the right boundary of the Discount column, release the mouse button.

We can see that order of the columns changes.
 Previous Topic
 Back to top