Data Table Tutorial - Manual
This topic is for new Logi developers. It guides you through the process of building a Logi report that presents data from your SQL database in a table. It uses mostly manual methods, rather than Studio's wizards, to create the report. This provides a more detailed, "behind-the-scenes" look at the process.
- Create a New Report Definition
- Add a Database Server Connection
- Add a Data Table
- Preview and Run Your Report
- Change the Theme
![]() This tutorial builds on the Hello World! Tutorial. Please complete that tutorial before proceeding with this one.
This tutorial builds on the Hello World! Tutorial. Please complete that tutorial before proceeding with this one.
We also offer a completely wizard-driven tutorial, Data Table Tutorial - Wizard, which uses Studio's Wizards exclusively to accomplish the same task.
Create a New Report Definition
Begin by launching Logi Studio, using its desktop icon or Start![]() All Programs
All Programs![]() Logi Info
Logi Info![]() Studio.
Studio.
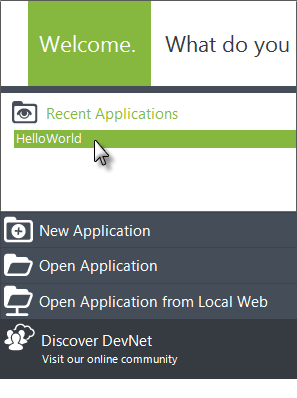
- In Logi Studio, close the Getting Started dialog box and re-open the HelloWorld application from the Welcome Panel, as shown above.
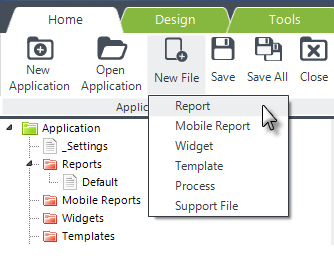
- Click the New File menu item, and select Report from its drop-down list of options, as shown above.
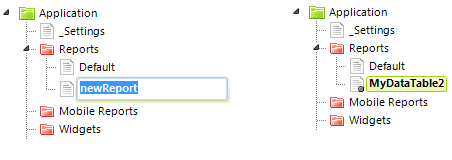
Studio will add a new report definition, named "newReport" in the Application Panel, and put it into rename mode. Just start typing a new name - such as "MyDataTable2" - and press Enter to rename it.
If something happens, like you click elsewhere, and it exits rename mode, just select the newReport definition and press F2, or right-click and select Rename, to rename it.
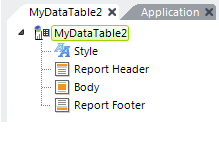
You probably noticed that the new definition was opened in the Workspace editor. It contains five key elements by default:
|
|
Reports may not always require the Style, Report Header, or Report Footer elements and they can be deleted in that case. However, we'll be using the Style element later, so don't delete it now.
Any report that displays data in a table also requires five more types of elements, which we'll work with next:
- A Connection to the database or other data source.
- A Data Table element, which defines the data presentation (rows and columns).
- A DataLayer element, to retrieve and cache the data.
- One or more Data Table Column elements, to organize the data.
- A Label element in each column to format and display the actual data.
Your next step is to create a connection to your database server.
Add a Database Server Connection
The Connection element comes in a variety of flavors, depending on the nature of the connection to be made. The best method of connecting is to use a vendor-specific connection element, such as Connection.Oracle, or Connection.MySQL, when you can. There are also generic connection elements.
The following example uses Connection.SQLServer to connect to Microsoft SQL Server. If you're using a different database server, substitute the appropriate elements and attributes in the following discussion.
Here's how to add a Connection element:
- In the Application Panel, double-click the _Settings definition to open it in the Workspace editor. You can see it opens in a different tab than the new definition you added earlier.
- Select the Connections element. In the Element Toolbox panel, double-click the connection element appropriate for your database server to add it. This is the basic technique for adding elements: select a parent element and double-click a child element which is then added beneath it.
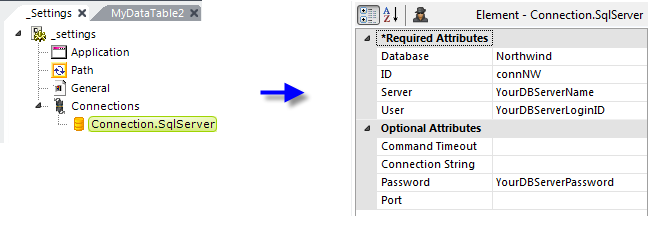
- When the newly-added connection element is selected, its properties or "attributes" will appear in the Attributes Panel. Find its ID attribute and set it to a unique value. The example uses connNW because we're going to connect to the Northwind database.
- In the Attributes Panel, provide the other attribute values shown above, using values appropriate for your database and server.
- Save your _Settings definition by clicking the Save item in the main menu
- Close the _Settings definition by clicking the "X" icon in its editor tab.
The connection is now configured and ready for use.
Add a Data Table
The Data Table element is used to display data in a tabular format of rows and columns. The following examples use a table, Employees, in the Northwind database. If you're using a different database and table, adjust the names and selections as appropriate.

Here's how to add a Data Table element:
- If it's not already selected, select the MyDataTable2 definition tab in the Workspace editor.
- In the definition, select the Body element.
- In the Element Toolbox, expand the Data Tables section (if necessary) and double-click the Data Table element to add it to the report as a child of the Body element, as shown above.
- With the newly added element selected, in the Attributes panel, set its required ID attribute.
To add the next element, let's use an alternate method, which you may find you prefer:
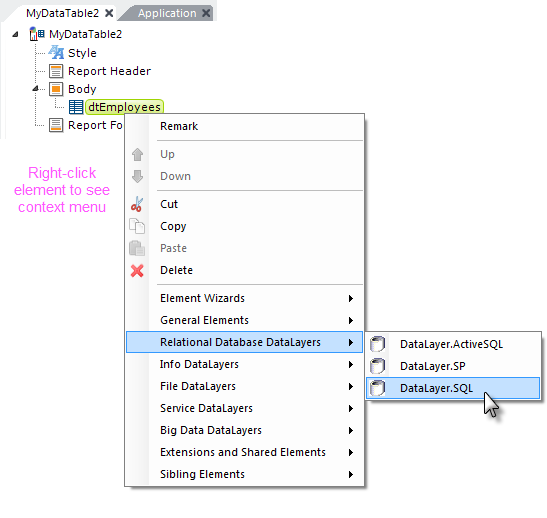
- Select the newly-added Data Table element ("dtEmployees"), and right-click it.
- In the context menu that appears, select Relational Database DataLayers.
- In the second context menu, click the DataLayer.SQL element to add it as a child of the Data Table element.

- Select the newly-added datalayer and set its attributes as shown above. The Connection ID can be selected from a pull-down list of choices. The Source attribute value is, obviously, the actual SQL query used to get data from the database and, if you're using a different database, you'll need to alter it.

- Select the Data Table element ("dtEmployees") again and below it add a Data Table Column element, as shown above. Set its ID attribute to colEmployeeID and its Column Header attribute to Employee ID.
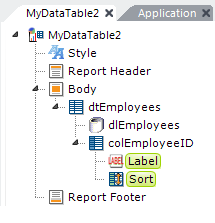
- Select the newly-added Data Table Column element and, below it, add Label and Sort child elements, as shown above.
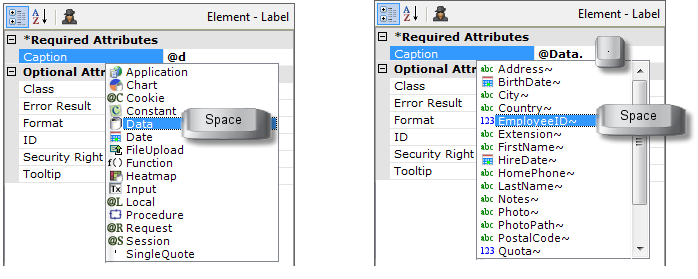
Now we'll use Studio's powerful "Token Completion" feature to fill-in the data value to be displayed for this column.
- Select the Label element and in its Caption attribute, type @d. Studio will immediately display a drop-down list of "token" types. A token is a value that is evaluated at runtime and is used in Logi apps to represent data, session variables, cookies, and more. In our case, we want to use a Data token. Studio has anticipated our need and selected the Data token type in the drop-down list. Press the Space Bar on your keyboard to select it and Studio will enter the token type in the Caption attribute.
- Now press the Period key and Studio will attempt to retrieve a list of the data columns returned by our SQL query. Use your arrow keys or the mouse to select EmployeeID~, as shown above left, and, again, press the Space Bar.
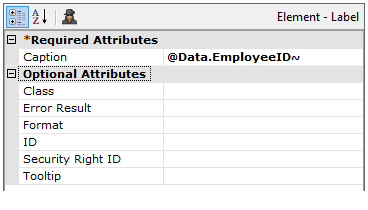
- Studio enters the column name in the Caption attribute, as shown above, and adds the trailing tilde ("~") character which is the required terminator for tokens. Here's another important fact about tokens: they're case-sensitive, so you must take care to spell them, and related identifiers such as column names, correctly.
Once you do this a few times, you'll find the Token Completion feature to be really valuable: it speeds things up and helps you avoid error-causing typos.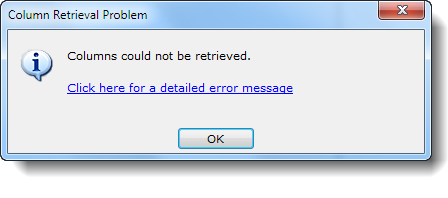
Did Studio return an error when it tried to retrieve the table column names? If so, you most likely have a problem with the configuration of your database connection or your SQL syntax. The link in the error message may provide a useful hint. Fix any problems and retry.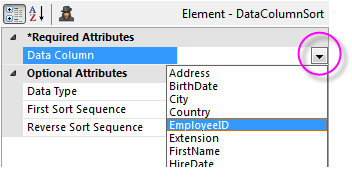
The Sort element causes the column header text in the table to become a link that will sort the data based on the column clicked. Select it and set its Data Column attribute to the column name: EmployeeID.
Note that if an attribute name includes the world "Column" then the attribute value must be the actual column name, not a Data token. The column name is case-sensitive and must be spelled correctly. You can click the button at the end of the attribute value input box to see a drop-down list of the column names.
This grouping of elements: Data Table Column, Label, and (optionally) Sort needs to be repeated for each column that you want to display. Now that you know what's involved, to save a little time, let's use a wizard to provide the other columns: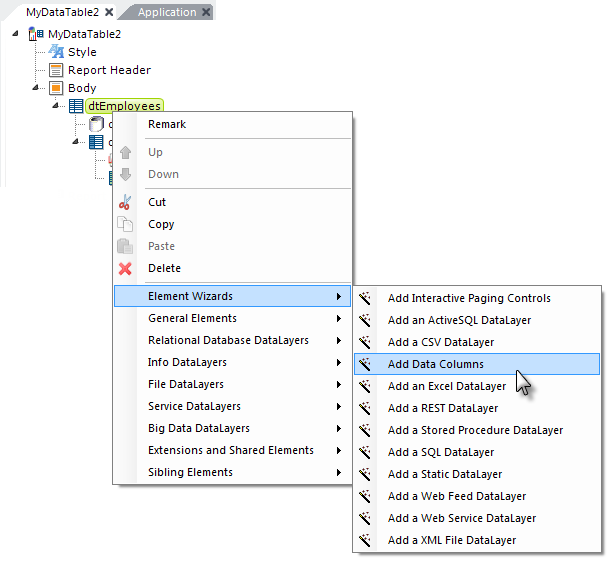
- Right-click the Data Table element ("dtEmployees"). Select Element Wizards from its context menu.
- In the second context menu, click Add Data Columns, as shown above.
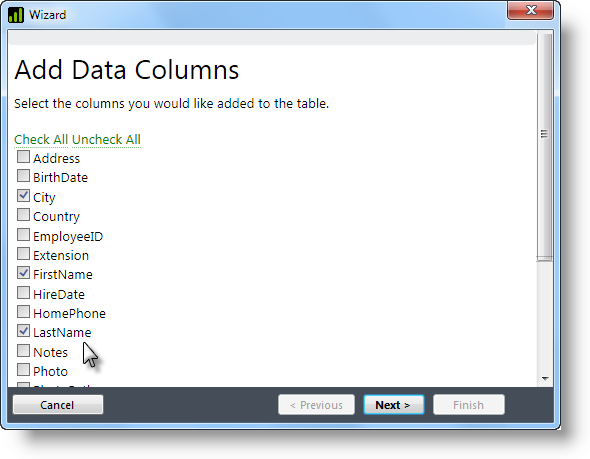
- When the wizard appears, as shown above, click the Uncheck All link, then check a few columns. Then click Next and watch in the Workspace editor as the wizard adds elements for you. Click Finish when it's done.
Click on some of the elements the wizard added and you can see that it has configured their attributes for you, too.
Now that all of the columns have been added, your data table is complete and you're ready to see the results.
Preview and Run the Report
You can preview the report right inside Studio:
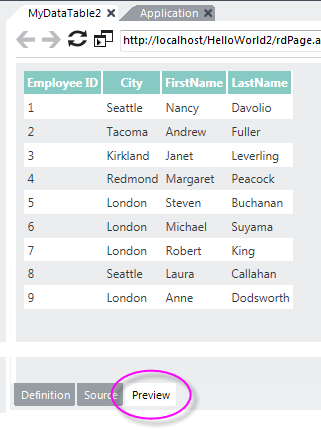
In the Workspace panel, click the Preview tab at the bottom. Your report should appear in the panel. Note that any changes to definitions (but not to support files, such as style sheets) are automatically saved when Preview is clicked. Click the column headers to see the sorting feature in action.
Let's clean up a few things before we move on. Let's rearrange the column order and set the column header titles.
- Click the Definition tab to return to the definition editor.
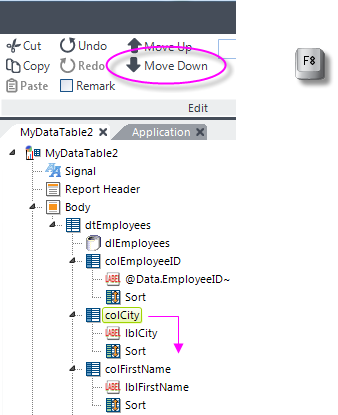
- In the MyDataTable2 definition, select the Data Table Column for the City data ("colCity").
- Use the Move Down item in the main menu, or the F8 key, to move the selected element down below the other data table column elements. Notice that its child elements (Label and Sort) move with it.
- Repeat this process with the First Name ("colFirstName") data table column element so we wind up with a column order of EmployeeID, LastName, FirstName, and City. Preview the results to check the order.
- Next, select each Data Table Column element in turn, and insert a space into its Column Header attribute value, separating the two words found there, so "FirstName" becomes "First Name", for example. Then preview the results again.
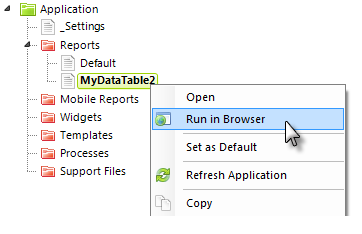
You can also view the results in your browser by right-clicking the MyDataTable2 definition in the Application Panel and selecting Run in Browser from its context menu.
Change the Theme
Your data table report is using the Signal theme, which was assigned to the Hello World application by default when it was created. However, you can experiment with other themes by assigning them to this report definition.
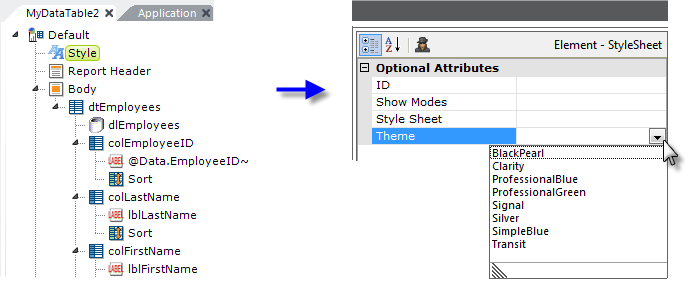
- Select the Style element at the top of your definition and, using its drop-down list of choices, set the Theme attribute to something other than Signal.
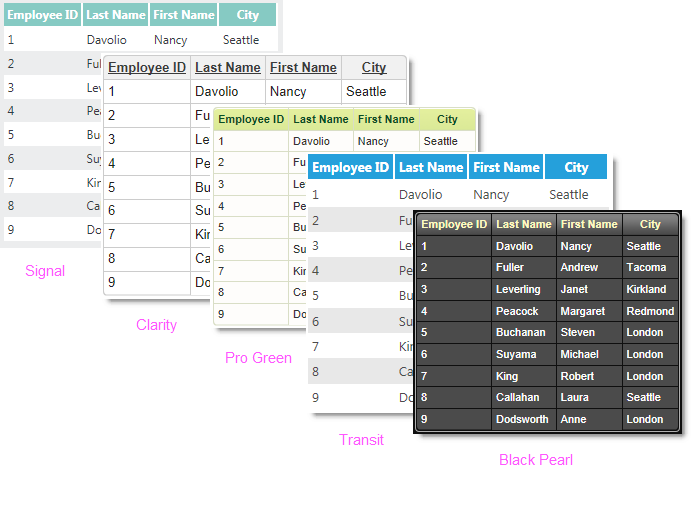
- Now preview the report and see what you get. Try a few other themes to see how they differ.
Themes are pre-configured settings and scripts that impart a specific look to the definition. They can be applied, as you did here, at the report definition level or, for the entire application, in the _Settings definition.
Finally, here are a few things to explore on your own:
- Examine the Label elements to ensure you understand how an @Data token relates to a column of data.
- Select any Data Table Column element, right-click it, and select Remark. Note that the element and all of its child elements now appear in a different color in the definition and, when you preview the report, that column is no longer visible.
Congratulations on completing this Data Table Tutorial.
