New option for 'live' export of Chart to PDF/Excel
Hey Logi Users!
I had a specific set of requirements for exporting a report with a JavaScript-modified Chart Canvas to PDF and to Excel:
- We need the exports to include all of the JS modifications
- We want the exports to be 'live', meaning that the export retains any user-edited Series. When the user clicks a Series in the Legend to 'hide' the Series, we want that 'hide' to render in the exports. Logi's Action.PDF and Action.NativeExcel options re-run the Chart which means that the user Legend clicks are removed from the exports
Since I created a solution for this, I wanted to post here in case anyone has improvements/input AND in case anyone else wants a 'live' export option like this! I'm hoping that someone with more JS/HTML chops can provide some improvements.
Anyhow... here is the code for the originating report:
<Report ID="TestSvgToCanvas">
<Body>
<Division ID="divExportOptions">
<Spaces Size="5" />
<Label Caption="export to excel">
<Action ID="jsGetPngtoExcel" Javascript="var horig = document.getElementById('Chart1').offsetHeight;
var hscale = 800/horig; //Set desired Excel height
var worig = document.getElementById('Chart1').offsetWidth;
var wscale = 1200/worig; //Set desired Excel height

var chart = Y.one('#Chart1')._data.rdChartCanvas.chart;
var svg = chart.getSVG({chart:{height:chart.chartHeight*hscale,width:chart.chartWidth*wscale}});
// Scale output from original to desired height/width
let svg64 = btoa(svg);
let b64Start = 'data:image/svg+xml;base64,';
let image64 = b64Start + svg64; 
// Get and modify base64 SVG data for writing to IMG

var canv = document.createElement('canvas');
canv.id = 'myCanvas';
canv.style.position = 'absolute';
canv.style.left = '-999em';
document.body.appendChild(canv);
document.getElementById('myCanvas').height=800;
document.getElementById('myCanvas').width=1200;
// Create and configure HTML CANVAS element, hiding with CSS

hdnImg.src = image64;// set hdnImg source to base64 SVG 

hdnImg.onload = x=> {
myCanvas.getContext('2d').drawImage(hdnImg, 0, 0); // Draw base64 SVG to Canvas element "myCanvas"
var pngURL = document.getElementById('myCanvas').toDataURL(); //get dataURL of hdnImg
document.getElementById('hdnPng').value = pngURL.substring(22); //strip off prefix ('b64start')

SubmitForm('rdPage.aspx?rdReport=TestSvgToCanvasExport&LinkHref=True&rdReportFormat=NativeExcel&rdShowGridlines=True&rdHasWaitPanel=True&rdExcelOutputFormat=Excel2007&rdExportFilename=ChartToExcel_@Date.Today~','_blank','false','',null,null);
// Run Export report as Excel

var canv2 = document.getElementById('myCanvas');
canv2.parentNode.removeChild(canv2);
};" Type="Javascript" />
</Label>
<Spaces Size="5" />
<Label Caption="export to pdf">
<Action ID="expPdf" Type="PDF">
<Target FrameID="NewWindow" Report="TestSvgToCanvasExport" Type="PDF">
<WaitPage />
</Target>
<Action ID="jsGetSvg" Javascript="var horig = document.getElementById('Chart1').offsetHeight;
var hscale = 700/horig; //Set desired PDF output height
var worig = document.getElementById('Chart1').offsetWidth;
var wscale = 1600/worig; //Set desired PDF output width

var chart = Y.one('#Chart1')._data.rdChartCanvas.chart;
var svg = chart.getSVG({chart:{height:chart.chartHeight*hscale,width:chart.chartWidth*wscale}});
// Scale output from original to desired height/width
document.getElementById('hdnSvg').value = svg; // Pass SVG to Hidden Input

return true;" Type="PreActionJavascript" />
</Action>
<Note Note="The PDF Export could be run as pure Action.Javascript but I left this is as an alternative using Pre-Action Javascript" />
</Label>
<LineBreak LineCount="2" />
</Division>
<ChartCanvas ChartHeight="500" ID="Chart1">
<Series ChartXDataColumn="date" ChartYDataColumn="value" ID="Line1" Type="Line" />
<DataLayer ID="sdl1" Type="Static" IdeDisplayStatus="Collapsed">
<StaticDataRow date="01/01/2020" value="5" type="fruit" />
<StaticDataRow date="01/01/2020" value="16" type="vegetable" />
<StaticDataRow date="02/01/2020" value="10" type="fruit" />
<StaticDataRow date="02/01/2020" value="4" type="vegetable" />
<StaticDataRow date="03/01/2020" value="2" type="vegetable" />
<StaticDataRow date="03/01/2020" value="8" type="fruit" />
<StaticDataRow date="04/01/2020" value="26" type="vegetable" />
<StaticDataRow date="04/01/2020" value="17" type="fruit" />
<CrosstabFilter CrosstabColumn="type" CrosstabLabelColumn="date" CrosstabValueColumn="value" CrosstabValueFunction="Any" ID="ctf1" />
</DataLayer>
<ChartCanvasLegend LegendCaption="Hide in Export" LegendOrientation="Vertical">
<Note Note="This process generates a 'live' export where the items hidden by clicking on the Legend show as hidden in the export output" />
</ChartCanvasLegend>
</ChartCanvas>
<InputHidden ID="hdnSvg">
<Note Note="Stores SVG for PDF export" />
</InputHidden>
<InputHidden ID="hdnPng">
<Note Note="Stores PNG for Excel Export" />
</InputHidden>
<Division HtmlDiv="True" ID="divImg">
<HtmlTag HtmlTagName="img" ID="hdnImg" />
<Note Note="Hidden IMG element used to copy to HTML Canvas" />
</Division>
<IncludeHtml Html="<style>
#divImg{
 position: absolute; 
 left: -999em;
}
</style>" ID="cssHideImg" />
</Body>
<ideTestParams />
</Report>
And here is the code for the Export/target report:
<Report ID="TestSvgToCanvasExport">
  <LocalData ID="ldPng">
    <DataLayer ID="dlStatic" Type="Static">
      <StaticDataRow base64="@Request.hdnPng~" />
      <FileColumn DataColumn="base64" Filename="@Function.AppPhysicalPath~\rdDownload\@Function.GUID~.png" ID="imgSrc" SavedFilenameColumnID="base64img" />
    </DataLayer>
  </LocalData>
  <Body>
    <Division HtmlDiv="True" ID="divExcel" ShowModes="rdExportExcel">
      <Image Caption="rdDownload/@Local.base64img~" ID="imgFromBase64" />
    </Division>
    <Division ID="divPDF" HtmlDiv="True" ShowModes="rdExportPdf">
      <IncludeHtml Html="@Request.hdnSvg~" ID="SvgAsHTMLImage" />
    </Division>
  </Body>
  <ideTestParams hdnPng="" hdnSvg="" />
</Report>
Regards,
Johnny
-
Hi Johnny,
I have created the chart canvas with series lines and bar line. By using your code I am getting the chart pdf export correctly.
But I need more modifications for in pdf export:
1. when there is no data in the chart, chart legends are visible in pdf export. I want those chart legends to be also hidden.

2. In my report, on the UI side when there is no data in the Chart we hide the chart division and show another division with the label "no data is present ". So we also want that in pdf export time that if there is no data in a chart division will hide and another division will show with a message.
3. In the pdf export report " TestSvgToCanvasExport" there is another division with a data table. After taking the pdf export chart is visible fine but the data table column header is not showing correctly. Is there an effect of JavaScript or page break?

So is it possible we can add this modification to your code or there is any other solution?
Thanks
Seema
0 -
Hi Seema,
Specific to item 1, I wonder why there is any legend appearing if there isn't a legend on your Main report. Literally, all that this sample does is grab an img of the Chart (including the Legend), saves it to an SVG and passes the SVG to an Export report. If there is no legend on the Main report, there should be no legend on the Export report.
For item 2 (and what may be used as an alternative solution for item 1), I recommend that you add a conditional NoData DIV to your Export report with output that matches your "No Data" output from the Main report. Then, in the JavaScript, do something to indicate No Data and save that into a Hidden Input, passing it to the Export report to hide the divPDF DIV and show the NoData DIV. An example of this could use the afterCreateChart event (with many thanks to VISUI
var verticalBarChartContainer = Y.one('#Chart1');
var SeriesData = [];
verticalBarChartContainer.on('afterCreateChart', function(e) {
    if (e.options.series == null|| e.options.series.length == 0)
        document.getElementByID('hdnNoData')=1;
//do other stuff
});
Add a HiddenInput named "hdnNoData", then set the condition on the Export NoData DIV to '@Request.hdnNoData~'=1 and the condition on divPDF to '@Request.hdnNoData~'<>1.
For item 3, there is nothing being passed (SVG/PDF or PNG/Excel) that should impact anything else on the Export report. I would recommend that you check all of the IDs for uniqueness on your Export report along with all CSS. There could be some conflicts being created over the definition, style, and specificity.
Please let us know how this process goes!
Regards,
Johnny0 -
Hi Johnny,
I have tried the above solution for "no data". But this is not working still I am getting the same output. Maybe the condition is not working. Please find the below screenshot:
Main report:
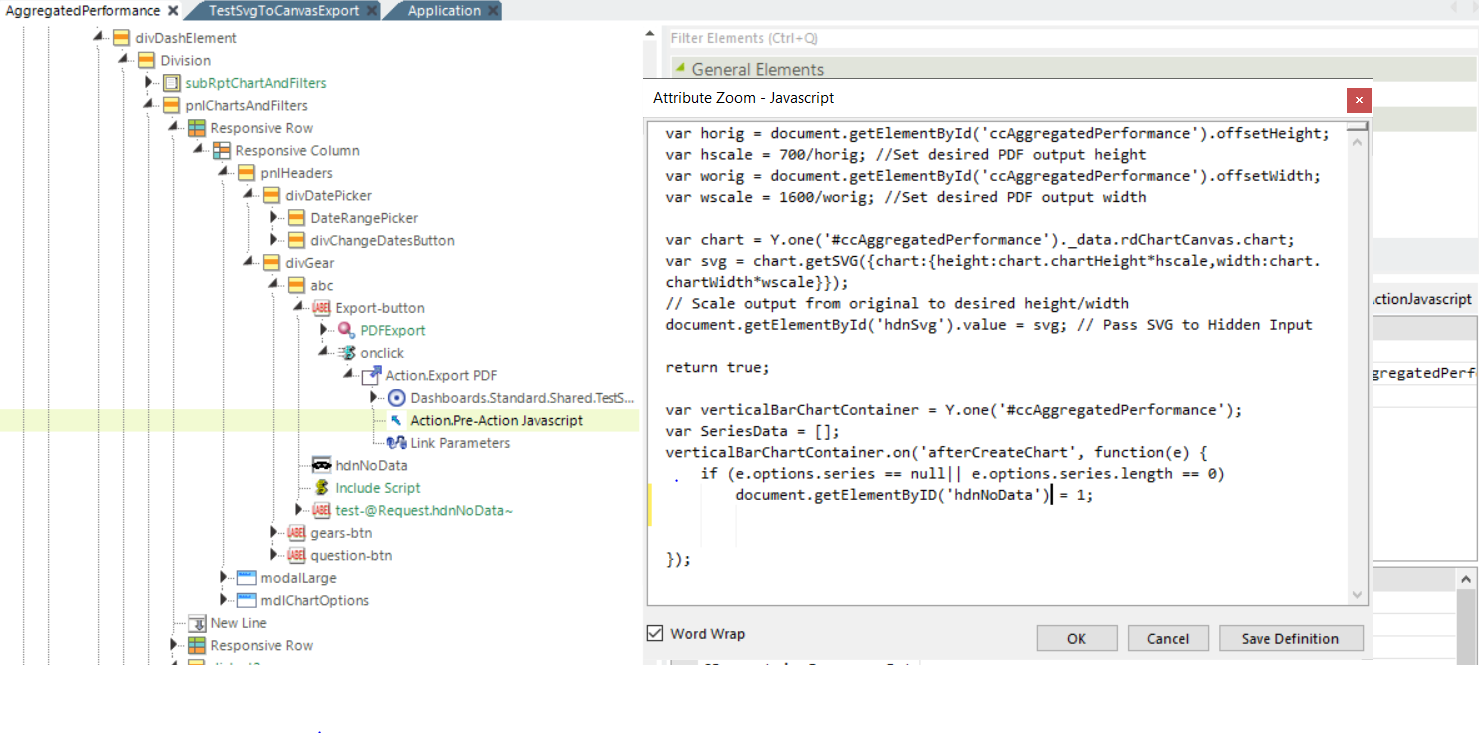
Export Report:
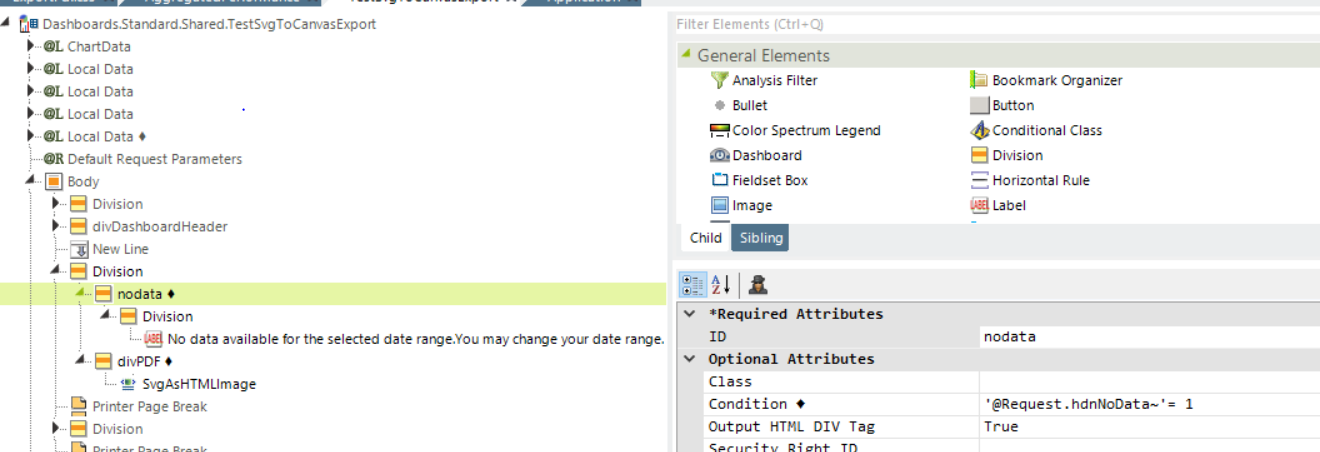
Please let me know if I am doing the correct or not. And if there is another way to solve this thing because this is the priority issue.
For 3rd item, I did some analysis. The column header is not showing correctly in the pdf because of the Printer page breaker element. Is there any other way to use the same functionality of the Printer page breaker element? We need a column header on all the pages of the pdf.
Thanks,
Seema
0 -
Hey Astro,
You need to move the new "varVerticalChartContainter...." code so that it runs before "return true;". Your code is bailing on return true and never sets the hdnNoData value. I also see that I included a typo in the last line of that code with an upper-case D in "ID"; should be lower-case.
Wrong code = document.getElementByID('hdnNoData')=1;
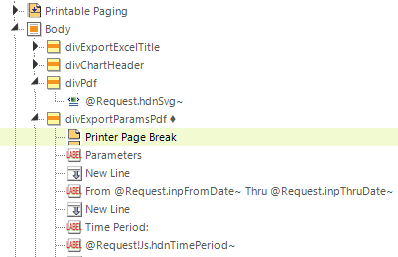
Correct code = document.getElementById('hdnNoData')=1;I'm not sure why the Printer Page Break is being finicky here. I have two things I would try if I were you:
- Give the Printer Page Break elements unique IDs and see if that resolves the issue
- Move the Printer Page Break elements into their Division elements
We have our Page Breaks in DIVs (without unique IDs) but we have only one Printer Page Break and we can't possibly be using the same CSS and Headers that you are. This isn't an indication of what WILL work, but perhaps what CAN work??
Regards,
Johnny0 -
Hey Johnny,
I have changed the script as you said but still, on "no data" chart legends are showing. Nodata div is not visible. Please find the below screenshot:
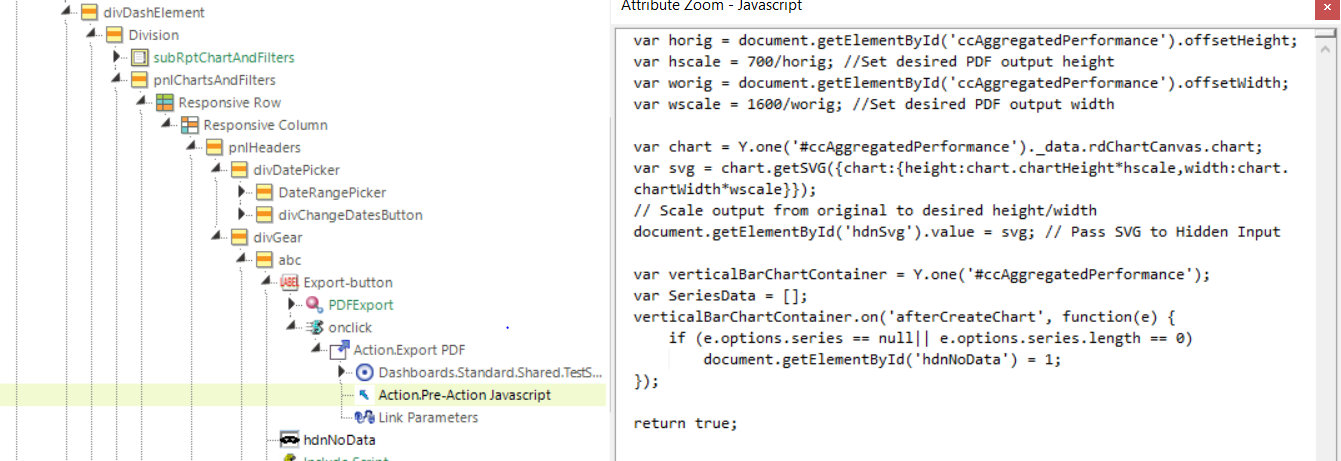
output:

For Printer Page Break :
1. By giving a unique id to Printer Page Break, still same output.
2. By Moving the Printer Page Break elements into their Division elements, the output will be changed completely. Because in my report there are 4 data tables and in pdf, I need that on every page column header will be present.
Thanks,
Seema
0 -
Hi Seema,
You will need to do some troubleshooting in your console and Logi Debugger for the hdnNoData token and condition. Is the value of '1' being assigned to the hdn Token prior to the return true command? You can check this by adding an alert or console.log into the script before return true;
If yes, Is the value being passed to the Export definition correctly? You can check this in the Export debugger.
If that is a yes, can you print the value of @Request.hdnNoData~ to the Export output to confirm that it is a '1'? etc, etc...Does your initial report show a Legend when there is no data? I find that odd at the outset... perhaps your ChartCanvas needs some editing to hide the Legend in our initial report.
I am not sure what to tell you for the Printer Page Breaks. If you remark out the divPDF and SVG-related elements, does your table come out correct? There could be any number of things breaking this and I'm not certain that they have anything to do with an SVG being displayed in the Export output.
Please keep us updated!
Johnny0 -
Hi Johnny,
I have checked the export debugger for hdnNoData token value, it is passing blank as shown in below screenshot:

I have also printed the value of @Request.hdnNoData~ to the Export output, it is also shown blank. I think 1 value is not assigned to the hdnNoData.

In our initial report legends are not shown because we add the same nodata div with the condition. That condition is different from this one. So is there any other way to show or hide the division for nodata?
Thanks
Seema
0 -
Hey Seema,
Are you able to use the same nodata condition from the main report and pass that to the Export report? That's all that I'm trying to do with the last code I sent you. If you have another Token that can condition the Export report to show divNoData, then you should use that.
If there isn't a Token, then you need to find some way to generate a Token. That is what I was trying to do with the hdnNoData mechanism I sent in the last code. I'm guessing that the Pre-Action Javascript is run asynch and never hits that part of the code to set the hdnNoData Token. I recommend that you play around with that piece to see if you can get the Token set correctly. Perhaps make the var verticalBarChartContainer the first thing that runs instead of the last? You'll need to figure out some way to make that piece run or find another code that will set a value for you when there is no data.
The other option is to set up the PDF export as Action.Javascript (instead of Action.PDF with Pre-Action Javascript). I believe the Pre-Action JS runs asynch so you lose control over the timing of all of the commands where the Action.Javascript allows you more freedom to run everything synchronously before the script 'ends'. You can use the Action.JS for the Excel as a model of this but modify it for PDF.
Given the troubles that you are having with this setup... if you are unable to get this working, I recommend that you use Logi's Action.PDF instead of this live export option. It appears that your use case is different enough that it is hurting you more than helping you.
Regards,
Johnny0 -
Hi Johnny,
Thanks for all the help. I'll work on the above scenarios that you mention.
Thanks,
Seema
0 -
Hi Johnny,
I am still stuck on this issue. I have tried the above approaches but still not get the desired output. So if you have any solution to solve this problem or hide the divNoData. How can we set hdnNoData token?
Thanks,
Seema
0 -
Hi Seema,
I recommend that you use Logi's standard Action elements for your use case.
Regards,
Johnny0 -
Hi Johnny,
I already used action elements but by using this my initial issue will produce again. By using the action element is not working. So there is any other solution to do in JavaScript or logi.
Thanks,
Seema
0 -
Hi Seema,
If you are having issues with the standard Action elements, I recommend that you contact Logi Support. If you are able to reproduce your issue in a small, sample report with static data that you can post here, the community may be able to assist you. I recommend that you place that sample in a new Post for better visibility.
Regards,
Johnny0
Please sign in to leave a comment.
Comments
13 comments