Always Sort Y-Axis the same??
I have a Series.Bar Chart where I want the Y-Axis to present "EStatus" values which should always be sorted alphabetically. The 3 options for EStatus are Late, Missing, On-Time. The issue that I'm seeing is that, if any of the EStatus values are not represented in the first Bars in the Series, the order changes to show whatever EStatus values are available at the bottom.
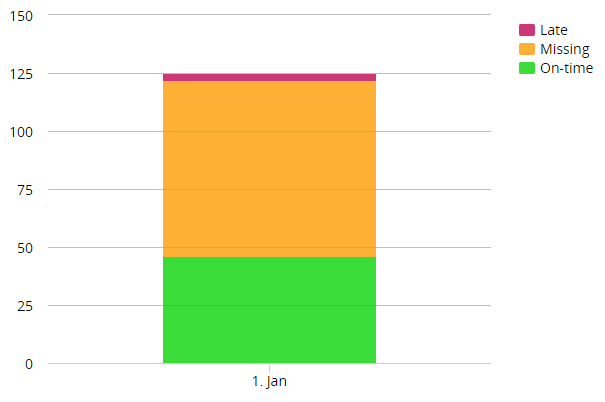
This is the correct order - Late, then Missing, then On-time with the Legend reversed to match the stacked bar output. This appears in order because all 3 EStatus values are represented when grouped by Month:

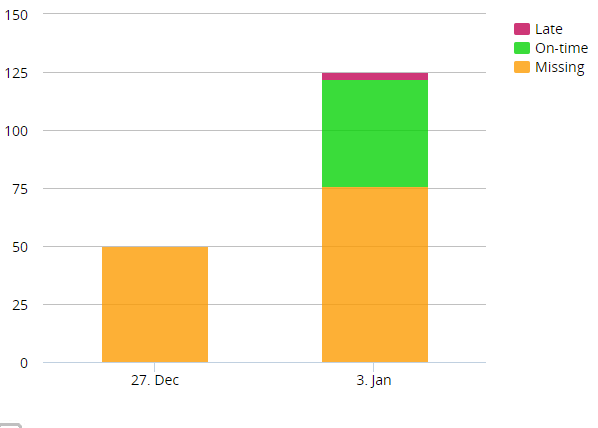
However, when I group by Week, where only "Missing" EStatuses have a value, the order switches, presumably because "Late" and "On-time" EStatuses do not have an available value in the first bars in the series:

How do I get the sort to always show in EStatus order ascending even if there are no values for all EStatuses for the first bar in the series?
Sample code:
<Report ID="TestYSort">
<DefaultRequestParams inpTimePeriod="Week" />
<Body>
<ChartCanvas ChartCaptionDated="{AggrName} of {DataColumnName} by {LabelColumnName} {LabelColumnDateGrouping}" ChartLabelColumnDataType="Text" ID="ChartCanvas1">
<Series Type="Bar" Color="@Chart.rdCrosstabValue-BarColor~" BarStacking="Stacked">
<DataLayer Type="Static">
<StaticDataRow Encounters="50" rdTime-DoS="2021-01-01" EStatus="Missing" BarColor="#fc9c04" />
<StaticDataRow Encounters="46" rdTime-DoS="2021-01-08" EStatus="On-time" BarColor="#09d309" />
<StaticDataRow Encounters="76" rdTime-DoS="2021-01-08" EStatus="Missing" BarColor="#fc9c04" />
<StaticDataRow Encounters="3" rdTime-DoS="2021-01-08" EStatus="Late" BarColor="#c20555" />
<TimePeriodColumn DataColumn="rdTime-DoS" ID="rdTime-DoS" TimePeriod="FirstDayOfMonth" IncludeCondition="'@Request.inpTimePeriod~'='Month'" />
<TimePeriodColumn DataColumn="rdTime-DoS" ID="rdTime-DoS" TimePeriod="FirstDayOfWeek" IncludeCondition="'@Request.inpTimePeriod~'='Week'" />
<SortFilter SortColumn="rdTime-DoS,EStatus" ID="sortTimeStatus" SortSequence="Ascending,Descending" />
<CrosstabFilter CrosstabValueColumn="Encounters" CrosstabValueFunction="Any" CrosstabColumn="EStatus" CrosstabLabelColumn="rdTime-DoS" ID="ctfStatusOverTime">
<ExtraCrosstabValueColumn CrosstabValueColumn="BarColor" CrosstabValueFunction="Any" ID="BarColor" />
</CrosstabFilter>
</DataLayer>
</Series>
<ChartCanvasLegend ReversedItemOrder="True" LegendOrientation="Vertical" />
</ChartCanvas>
<Division ID="divTimePeriod" HtmlDiv="True">
<InputSelectList ID="inpTimePeriod" DefaultValue="@Request.inpTimePeriod~" OptionCaptionColumn="id" OptionValueColumn="id">
<DataLayer Type="Static" ID="dlsTimePeriod">
<StaticDataRow id="Week" />
<StaticDataRow id="Month" />
</DataLayer>
<EventHandler DhtmlEvent="onchange">
<Action Type="Report" ID="actReport">
<Target Type="Report" />
</Action>
</EventHandler>
</InputSelectList>
</Division>
</Body>
<ideTestParams inpTimePeriod="" />
</Report>
-
What if you were to take your categories and time period as a data-set and then left join over to the actual data? This would make sure everything combination always has a row which I think would fix your display.
0
Please sign in to leave a comment.
Comments
1 comment