Sharing DataLayers in a Single Report

I wanted to share this to see what others think. It is my solution for keeping everything in one place.
I have a reports that utilizes 2 DataLayers, one for Charts, one for Tables. I wanted have the DataLayers in one place to be shared, DataLayerLink, since there are 10 charts and 5 data tables. This report refreshes the data every 12 seconds so I needed quick response time. I did not want a Share Element, I like everything in one place for this report.
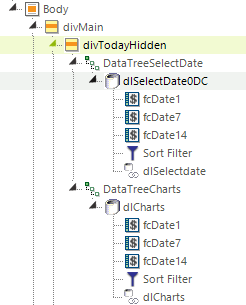
The solution I came up with was to use a DataTree for each which I put under a hidden div, Show Modes-None. Response time is almost instant.
Cheers,
Steve
-

Hi Steve,
Thank you for sharing, this is a useful way to load data. However there are some other methods worth considering depending on your use case. The most common is to use local data layers. Using local data layers provides you with the ability to add data layer links and share the data with charts and other visuals on the page, but it also gives you the ability to use the @Local token. The @Local token is used with an included column name and gives you access to the top row of data returned, which is useful for setting Session and Request parameters or configuring KPI panels and gauges especially if you are including aggregate columns.
Local data layers are synchronous. This is a double edged sword. When you want things to occur in a specific order, i.e. set some request parameters based on the results of an earlier database query (using @Local...~) to implement stored user preferences or user context, this is very useful. However if you want to load two or more data layers for use throughout the report by utilising data layer links and you don't need to access the top row of data for parameter setting, they will run one at a time when it would be more efficient to run them asynchronously.
There are several elements that are designed to be asynchronous within Logi Info. This includes the Chart Canvas element and also the Data Table element. In debug mode you will see that these elements have links to a separate asynchronous thread log. You can use this to your advantage when trying to build efficiencies into your report. For example a group of chart definitions that perform the initial queries with data layer links can then be used by other visuals with linked data layers. A useful approach I use is very similar to the one you described. This includes a hidden div, but instead of using the data tree, I use a data table without any column definitions. This does two things, it runs each table data layer in it's own asynchronous thread, and it does not waste time serialising XML content as there are no column definitions.Note that the effectiveness of your asynchronous processing does also come down to things like number of physical server processors and cores as well as availability of RAM or JVM memory allocations. Then database server power, clustering, data preparation, database type and tuning techniques all add another layer to your data performance
One final approach is to use data layer caches. Data layer caches can have a significant impact on database load. If you have highly volatile data, for example if you connect to transactional system databases (either directly or to the failover server), this is not so useful. However if you connect to a data warehouse or reporting data store that is updated after a few minutes, hourly, daily or beyond, then this can be a very efficient approach. Most people use data layer caches with lookups where the data does not change often, however they are very useful for report visualisations too.Data layer caches use the concepts of cache keys and expiration times. The Logi Info engine will first check to see if a cache file with the same cache key exists. If it does it will just use it instead of hitting the database. if it doesn't it will run the query and generate the cache. The cache is cleaned up when the expiry time/time period is met, and the next data layer to run a query with the same cache key will regenerate it once again.
A data layer cache key can be parameterised. This means you can set up keys for specific groups, users, specific locales, or specific filter combinations. You must make a decision on how far you take this as you may end up generating thousands of caches which can impact storage. Another useful aspect of data layer caches, that can mitigate the proliferation of cache files, is that a data layer cache can take further filters and calculated columns etc, so your cache may contain a level of aggregated data to aid performance and reduce load on the database, but it can still be further refined by an end user.
Multiple visuals across multiple reports can all use the same data layer cache definition with the same cache key, so it doesn't just benefit the single report page or session, it benefits all sessions, reports and visuals that use it. You can also setup scheduled processes that can go and regenerate caches out of peak ours or that coincide with data load completion. It is good practice to parameterise the expire now attribute on your data layer cache element. This allows you or a process to force the cache to regenerate by passing a parameter on a URI query string.
Thank you once again for sharing, I hope this additional information is also useful!
2 -
Hi Glyn,
Thank you for this great response, I have much to take away from this and sure it will be helpful for anyone wanting to take a similar approach.
All help is most welcome, I am the sole developer with Logi Info at my company and have no previous professional experience with anything like this including SQL, MySQL, etc. I am a Mainframe assembler guy which might possibly explain much of my approach. However, 7 years on, and thanks to the great Logi Customer support, I feel I am a ninja in training!!
I was unable to get local data layers to work with this, I had tried but ended up using the data tree. The data is refreshed every 12 seconds mostly to feed the 5 charts. Only one chart is displayed at any one time switching to the next after 12 seconds, rotating through them all each minute. Any chart can be selected, when doing so this freezes the rotation, there is a button to resume rotation. This is so a screen shot can be taken when required. The vital elements are the 5 data tables.
There are 5 systems monitored with this report plus 3 other similar reports making 20 in total. It warns our Service Availability Managers of any potential problems with major revenue generating channels, as such it is highly visible and extremely important. The data tables compare current data with data from last week and the week before, highlighting reduction in data when thresholds are exceeded. There is also a scheduler that compliments these that sends out email when these thresholds are exceeded.
I had originally shared the data from the first table in the report, instead I wanted to have the data in one place behind the hidden div. Being the only developer I wanted to ensure anyone taking over from me would find my reports easy to comprehend. I found a data tree and thought that might be a way to go. I will follow your example and replace the data tree with a data table.
Data Layer caches are something I really need to use. However, many of my reports use Datalayer.ActiveSQL which does not use datalayer cache. However, finding the time to rewrite dozens of reports is one problem that is holding me back from both utilizing cache and also replacing Datalayer.ActiveSQL. It certainly is on my to-do list.
As a foot note. I have discovered that Datalayer.ActiveSQL is not necessarily the best approach to take thanks to the Ninja session during Logi Spark 2021. Response time in one report was reduce from extremely long/no data retrieved to a few seconds by sticking with regular datalayers. This possibly might be due to the data residing in MySQL.
Thanks again for this detailed response, it is much appreciated.
0
Please sign in to leave a comment.
Comments
2 comments