Stacked clustered Bar.Series option?
I am working on a report definition with a unique requirement. Our data shows a series of Encounters in one of 3 EStatuses (Missing, Late, On-Time) across Rooms with a DatePeriod (pre-calculated to the Week Start DT) for each Encounter.
I want to end with a bar chart, stacked with EStatus values (so each bar will have no more than 3 segments - Missing, Late, On-Time). However, these stacked bars need to be grouped by DatePeriod, and within each DatePeriod by Room.
Given the sample data I'm including, the X-Axis should show "06/27/2021", "07/04/2021", "07/11/2021", "07/18/2021", and "07/25/2021". Within each of these dates, there should be a single bar for each Room showing that Room's stacked EStatus EncounterNbrCounts.
The best I've been able to do is a separate bar for each Room AND EStatus across each DatePeriod value, but I want to stack the EStatuses by Room by DatePeriod.
Any ideas on how to make this happen? I'm running Info 12.7 SP8
Sample Code:
<Report ID="Scheduling.On-TimeEncounters" Caption="On-Time Encounters">
  <Body>
    <ChartCanvas ID="ChartCanvas1">
      <DataLayer Type="XMLFile" XMLFile="OTEDataSortedByRoom.xml" MaxRows="200" ID="ChartQuery">
        <DataLayerLink ID="dllData" />
      </DataLayer>
      <Series Type="Bar" ID="BarChartOnTime" BarStacking="SideBySide" ChartXDataColumn="DatePeriod" ChartXDataColumnType="DateTime" Color="@Chart.rdCrosstabValue-BarColor~">
        <DataLayer Type="Linked" LinkedDataLayerID="dllData" ID="linkDataOnTime">
          <CompareFilter CompareType="=" DataColumn="EStatus" ID="compOnTime" CompareValue="On-Time" />
          <CrosstabFilter CrosstabColumn="Room" CrosstabLabelColumn="DatePeriod" CrosstabValueColumn="EncounterNbr" CrosstabValueFunction="Count" ID="ctfGrouped">
            <ExtraCrosstabValueColumn CrosstabValueColumn="BarColor" CrosstabValueFunction="Any" ID="BarColor" />
          </CrosstabFilter>
        </DataLayer>
      </Series>
      <Series Type="Bar" ID="BarChartMissing" BarStacking="SideBySide" ChartXDataColumn="DatePeriod" ChartXDataColumnType="DateTime" Color="@Chart.rdCrosstabValue-BarColor~">
        <DataLayer Type="Linked" LinkedDataLayerID="dllData" ID="linkDataMissing">
          <CompareFilter CompareType="=" DataColumn="EStatus" ID="compMissing" CompareValue="Missing" />
          <CrosstabFilter CrosstabColumn="Room" CrosstabLabelColumn="DatePeriod" CrosstabValueColumn="EncounterNbr" CrosstabValueFunction="Count" ID="ctfGrouped">
            <ExtraCrosstabValueColumn CrosstabValueColumn="BarColor" CrosstabValueFunction="Any" ID="BarColor" />
          </CrosstabFilter>
        </DataLayer>
      </Series>
      <Series Type="Bar" ID="BarChartLate" BarStacking="SideBySide" ChartXDataColumn="DatePeriod" ChartXDataColumnType="DateTime" Color="@Chart.rdCrosstabValue-BarColor~">
        <DataLayer Type="Linked" LinkedDataLayerID="dllData" ID="linkDataMissing">
          <CompareFilter CompareType="=" DataColumn="EStatus" ID="compLate" CompareValue="Late" />
          <CrosstabFilter CrosstabColumn="Room" CrosstabLabelColumn="DatePeriod" CrosstabValueColumn="EncounterNbr" CrosstabValueFunction="Count" ID="ctfGrouped">
            <ExtraCrosstabValueColumn CrosstabValueColumn="BarColor" CrosstabValueFunction="Any" ID="BarColor" />
          </CrosstabFilter>
        </DataLayer>
      </Series>
      <ChartXAxis ID="xDates">
        <AxisLabelStyle FontAngle="55" FontSize="12" Format="MM/dd/yyyy" />
      </ChartXAxis>
    </ChartCanvas>
  </Body>
  <ideTestParams />
</Report>
Sample XML Data:
<?xml version="1.0" encoding="utf-8"?>
<rdData>
<ChartCanvas1 EncounterNbr="181742" Room="Artis Q-Rm 2" Patient_x0020_Type="Outpatient" DoS="2021-07-11T00:00:00-04:00" EStatus="Missing" BarColor="#fc9c04" DatePeriod="2021 Jul 11" />
<ChartCanvas1 EncounterNbr="181890" Room="Artis Q-Rm 2" Patient_x0020_Type="Outpatient" DoS="2021-07-11T00:00:00-04:00" EStatus="Missing" BarColor="#fc9c04" DatePeriod="2021 Jul 11" />
<ChartCanvas1 EncounterNbr="181717" Room="Artis Q-Rm 2" Patient_x0020_Type="Inpatient" DoS="2021-07-11T00:00:00-04:00" EStatus="Late" BarColor="#c20555" DatePeriod="2021 Jul 11" />
<ChartCanvas1 EncounterNbr="172326" Room="Artis Q-Rm 2" Patient_x0020_Type="Outpatient" DoS="2021-07-11T00:00:00-04:00" EStatus="Missing" BarColor="#fc9c04" DatePeriod="2021 Jul 11" />
<ChartCanvas1 EncounterNbr="181802" Room="Artis Q-Rm 2" Patient_x0020_Type="Outpatient" DoS="2021-07-11T00:00:00-04:00" EStatus="Late" BarColor="#c20555" DatePeriod="2021 Jul 11" />
<ChartCanvas1 EncounterNbr="172356" Room="Artis Q-Rm 2" Patient_x0020_Type="Outpatient" DoS="2021-07-11T00:00:00-04:00" EStatus="Missing" BarColor="#fc9c04" DatePeriod="2021 Jul 11" />
<ChartCanvas1 EncounterNbr="181814" Room="Artis Q-Rm 2" Patient_x0020_Type="Inpatient" DoS="2021-07-11T00:00:00-04:00" EStatus="Late" BarColor="#c20555" DatePeriod="2021 Jul 11" />
<ChartCanvas1 EncounterNbr="181528" Room="Artis Q-Rm 2" Patient_x0020_Type="Outpatient" DoS="2021-07-11T00:00:00-04:00" EStatus="Late" BarColor="#c20555" DatePeriod="2021 Jul 11" />
<ChartCanvas1 EncounterNbr="172469" Room="Artis Q-Rm 2" Patient_x0020_Type="Outpatient" DoS="2021-07-11T00:00:00-04:00" EStatus="Late" BarColor="#c20555" DatePeriod="2021 Jul 11" />
<ChartCanvas1 EncounterNbr="181834" Room="Artis Q-Rm 2" Patient_x0020_Type="Outpatient" DoS="2021-07-11T00:00:00-04:00" EStatus="Late" BarColor="#c20555" DatePeriod="2021 Jul 11" />
<ChartCanvas1 EncounterNbr="176876" Room="Artis Q-Rm 2" Patient_x0020_Type="Outpatient" DoS="2021-07-11T00:00:00-04:00" EStatus="Late" BarColor="#c20555" DatePeriod="2021 Jul 11" />
<ChartCanvas1 EncounterNbr="181883" Room="Artis Q-Rm 2" Patient_x0020_Type="Inpatient" DoS="2021-07-11T00:00:00-04:00" EStatus="Late" BarColor="#c20555" DatePeriod="2021 Jul 11" />
<ChartCanvas1 EncounterNbr="181900" Room="Artis Q-Rm 2" Patient_x0020_Type="Inpatient" DoS="2021-07-11T00:00:00-04:00" EStatus="Late" BarColor="#c20555" DatePeriod="2021 Jul 11" />
<ChartCanvas1 EncounterNbr="181895" Room="Artis Q-Rm 2" Patient_x0020_Type="Outpatient" DoS="2021-07-11T00:00:00-04:00" EStatus="Late" BarColor="#c20555" DatePeriod="2021 Jul 11" />
<ChartCanvas1 EncounterNbr="181418" Room="Artis Q-Rm 2" Patient_x0020_Type="Outpatient" DoS="2021-07-11T00:00:00-04:00" EStatus="Missing" BarColor="#fc9c04" DatePeriod="2021 Jul 11" />
<ChartCanvas1 EncounterNbr="181655" Room="Artis Q-Rm 2" Patient_x0020_Type="Inpatient" DoS="2021-07-11T00:00:00-04:00" EStatus="Late" BarColor="#c20555" DatePeriod="2021 Jul 11" />
<ChartCanvas1 EncounterNbr="181386" Room="Artis Q-Rm 2" Patient_x0020_Type="Outpatient" DoS="2021-07-11T00:00:00-04:00" EStatus="Late" BarColor="#c20555" DatePeriod="2021 Jul 11" />
<ChartCanvas1 EncounterNbr="181486" Room="Artis Q-Rm 2" Patient_x0020_Type="Outpatient" DoS="2021-07-11T00:00:00-04:00" EStatus="Late" BarColor="#c20555" DatePeriod="2021 Jul 11" />
<ChartCanvas1 EncounterNbr="172098" Room="Artis Q-Rm 2" Patient_x0020_Type="Outpatient" DoS="2021-07-11T00:00:00-04:00" EStatus="Late" BarColor="#c20555" DatePeriod="2021 Jul 11" />
<ChartCanvas1 EncounterNbr="180765" Room="Artis Q-Rm 2" Patient_x0020_Type="Outpatient" DoS="2021-07-18T00:00:00-04:00" EStatus="Missing" BarColor="#fc9c04" DatePeriod="2021 Jul 18" />
<ChartCanvas1 EncounterNbr="176622" Room="Artis Q-Rm 2" Patient_x0020_Type="Outpatient" DoS="2021-07-11T00:00:00-04:00" EStatus="Late" BarColor="#c20555" DatePeriod="2021 Jul 11" />
<ChartCanvas1 EncounterNbr="181700" Room="Artis Q-Rm 2" Patient_x0020_Type="Inpatient" DoS="2021-07-11T00:00:00-04:00" EStatus="Late" BarColor="#c20555" DatePeriod="2021 Jul 11" />
<ChartCanvas1 EncounterNbr="181735" Room="Artis Q-Rm 2" Patient_x0020_Type="Outpatient" DoS="2021-07-11T00:00:00-04:00" EStatus="Late" BarColor="#c20555" DatePeriod="2021 Jul 11" />
<ChartCanvas1 EncounterNbr="181519" Room="Artis Q-Rm 2" Patient_x0020_Type="Outpatient" DoS="2021-07-11T00:00:00-04:00" EStatus="Late" BarColor="#c20555" DatePeriod="2021 Jul 11" />
<ChartCanvas1 EncounterNbr="181286" Room="Artis Q-Rm 2" Patient_x0020_Type="Outpatient" DoS="2021-07-18T00:00:00-04:00" EStatus="Missing" BarColor="#fc9c04" DatePeriod="2021 Jul 18" />
<ChartCanvas1 EncounterNbr="181488" Room="Artis Q-Rm 2" Patient_x0020_Type="Inpatient" DoS="2021-07-04T00:00:00-04:00" EStatus="Missing" BarColor="#fc9c04" DatePeriod="2021 Jul 04" />
<ChartCanvas1 EncounterNbr="181525" Room="Artis Q-Rm 2" Patient_x0020_Type="Inpatient" DoS="2021-07-11T00:00:00-04:00" EStatus="Late" BarColor="#c20555" DatePeriod="2021 Jul 11" />
<ChartCanvas1 EncounterNbr="181526" Room="Artis Q-Rm 2" Patient_x0020_Type="Inpatient" DoS="2021-07-04T00:00:00-04:00" EStatus="Late" BarColor="#c20555" DatePeriod="2021 Jul 04" />
<ChartCanvas1 EncounterNbr="181543" Room="Artis Q-Rm 2" Patient_x0020_Type="Inpatient" DoS="2021-07-04T00:00:00-04:00" EStatus="On-Time" BarColor="#09d309" DatePeriod="2021 Jul 04" />
<ChartCanvas1 EncounterNbr="180993" Room="Artis Q-Rm 2" Patient_x0020_Type="Outpatient" DoS="2021-07-11T00:00:00-04:00" EStatus="Late" BarColor="#c20555" DatePeriod="2021 Jul 11" />
<ChartCanvas1 EncounterNbr="180983" Room="Artis Q-Rm 2" Patient_x0020_Type="Outpatient" DoS="2021-07-11T00:00:00-04:00" EStatus="Late" BarColor="#c20555" DatePeriod="2021 Jul 11" />
<ChartCanvas1 EncounterNbr="181565" Room="Artis Q-Rm 2" Patient_x0020_Type="Inpatient" DoS="2021-07-04T00:00:00-04:00" EStatus="Late" BarColor="#c20555" DatePeriod="2021 Jul 04" />
<ChartCanvas1 EncounterNbr="181352" Room="Artis Q-Rm 2" Patient_x0020_Type="Outpatient" DoS="2021-07-11T00:00:00-04:00" EStatus="Late" BarColor="#c20555" DatePeriod="2021 Jul 11" />
<ChartCanvas1 EncounterNbr="181597" Room="Artis Q-Rm 2" Patient_x0020_Type="Inpatient" DoS="2021-07-11T00:00:00-04:00" EStatus="Late" BarColor="#c20555" DatePeriod="2021 Jul 11" />
<ChartCanvas1 EncounterNbr="181304" Room="Artis Q-Rm 2" Patient_x0020_Type="Outpatient" DoS="2021-07-04T00:00:00-04:00" EStatus="Missing" BarColor="#fc9c04" DatePeriod="2021 Jul 04" />
<ChartCanvas1 EncounterNbr="181362" Room="Artis Q-Rm 2" Patient_x0020_Type="Inpatient" DoS="2021-07-04T00:00:00-04:00" EStatus="Late" BarColor="#c20555" DatePeriod="2021 Jul 04" />
<ChartCanvas1 EncounterNbr="180438" Room="Artis Q-Rm 2" Patient_x0020_Type="Outpatient" DoS="2021-07-04T00:00:00-04:00" EStatus="On-Time" BarColor="#09d309" DatePeriod="2021 Jul 04" />
<ChartCanvas1 EncounterNbr="180301" Room="Artis Q-Rm 2" Patient_x0020_Type="Outpatient" DoS="2021-07-11T00:00:00-04:00" EStatus="Late" BarColor="#c20555" DatePeriod="2021 Jul 11" />
<ChartCanvas1 EncounterNbr="181337" Room="Artis Q-Rm 2" Patient_x0020_Type="Outpatient" DoS="2021-07-04T00:00:00-04:00" EStatus="Late" BarColor="#c20555" DatePeriod="2021 Jul 04" />
<ChartCanvas1 EncounterNbr="181100" Room="Artis Q-Rm 2" Patient_x0020_Type="Outpatient" DoS="2021-07-04T00:00:00-04:00" EStatus="Late" BarColor="#c20555" DatePeriod="2021 Jul 04" />
<ChartCanvas1 EncounterNbr="181442" Room="Artis Q-Rm 2" Patient_x0020_Type="Inpatient" DoS="2021-07-04T00:00:00-04:00" EStatus="Late" BarColor="#c20555" DatePeriod="2021 Jul 04" />
<ChartCanvas1 EncounterNbr="181395" Room="Artis Q-Rm 2" Patient_x0020_Type="Outpatient" DoS="2021-07-04T00:00:00-04:00" EStatus="Late" BarColor="#c20555" DatePeriod="2021 Jul 04" />
<ChartCanvas1 EncounterNbr="181185" Room="Artis Q-Rm 2" Patient_x0020_Type="Outpatient" DoS="2021-07-04T00:00:00-04:00" EStatus="Late" BarColor="#c20555" DatePeriod="2021 Jul 04" />
<ChartCanvas1 EncounterNbr="181453" Room="Artis Q-Rm 2" Patient_x0020_Type="Inpatient" DoS="2021-07-11T00:00:00-04:00" EStatus="Late" BarColor="#c20555" DatePeriod="2021 Jul 11" />
<ChartCanvas1 EncounterNbr="181326" Room="Artis Q-Rm 2" Patient_x0020_Type="Outpatient" DoS="2021-07-04T00:00:00-04:00" EStatus="Late" BarColor="#c20555" DatePeriod="2021 Jul 04" />
<ChartCanvas1 EncounterNbr="181473" Room="Artis Q-Rm 2" Patient_x0020_Type="Inpatient" DoS="2021-07-04T00:00:00-04:00" EStatus="Late" BarColor="#c20555" DatePeriod="2021 Jul 04" />
<ChartCanvas1 EncounterNbr="181480" Room="Artis Q-Rm 2" Patient_x0020_Type="Outpatient" DoS="2021-07-04T00:00:00-04:00" EStatus="Late" BarColor="#c20555" DatePeriod="2021 Jul 04" />
<ChartCanvas1 EncounterNbr="181164" Room="Artis Q-Rm 2" Patient_x0020_Type="Inpatient" DoS="2021-07-11T00:00:00-04:00" EStatus="Late" BarColor="#c20555" DatePeriod="2021 Jul 11" />
<ChartCanvas1 EncounterNbr="172697" Room="Artis Q-Rm 2" Patient_x0020_Type="Outpatient" DoS="2021-07-04T00:00:00-04:00" EStatus="On-Time" BarColor="#09d309" DatePeriod="2021 Jul 04" />
<ChartCanvas1 EncounterNbr="181119" Room="Artis Q-Rm 2" Patient_x0020_Type="Outpatient" DoS="2021-07-04T00:00:00-04:00" EStatus="Late" BarColor="#c20555" DatePeriod="2021 Jul 04" />
<ChartCanvas1 EncounterNbr="181084" Room="Artis Q-Rm 2" Patient_x0020_Type="Outpatient" DoS="2021-07-04T00:00:00-04:00" EStatus="Late" BarColor="#c20555" DatePeriod="2021 Jul 04" />
<ChartCanvas1 EncounterNbr="181233" Room="Artis Q-Rm 2" Patient_x0020_Type="Inpatient" DoS="2021-07-04T00:00:00-04:00" EStatus="Late" BarColor="#c20555" DatePeriod="2021 Jul 04" />
<ChartCanvas1 EncounterNbr="181264" Room="Artis Q-Rm 2" Patient_x0020_Type="Inpatient" DoS="2021-07-04T00:00:00-04:00" EStatus="Late" BarColor="#c20555" DatePeriod="2021 Jul 04" />
<ChartCanvas1 EncounterNbr="180799" Room="Artis Q-Rm 2" Patient_x0020_Type="Outpatient" DoS="2021-07-04T00:00:00-04:00" EStatus="Late" BarColor="#c20555" DatePeriod="2021 Jul 04" />
<ChartCanvas1 EncounterNbr="171238" Room="Artis Q-Rm 2" Patient_x0020_Type="Outpatient" DoS="2021-07-04T00:00:00-04:00" EStatus="Late" BarColor="#c20555" DatePeriod="2021 Jul 04" />
<ChartCanvas1 EncounterNbr="180804" Room="Artis Q-Rm 2" Patient_x0020_Type="Outpatient" DoS="2021-07-04T00:00:00-04:00" EStatus="On-Time" BarColor="#09d309" DatePeriod="2021 Jul 04" />
<ChartCanvas1 EncounterNbr="180806" Room="Artis Q-Rm 2" Patient_x0020_Type="Outpatient" DoS="2021-07-04T00:00:00-04:00" EStatus="Missing" BarColor="#fc9c04" DatePeriod="2021 Jul 04" />
<ChartCanvas1 EncounterNbr="164975" Room="Artis Q-Rm 2" Patient_x0020_Type="Outpatient" DoS="2021-07-04T00:00:00-04:00" EStatus="Late" BarColor="#c20555" DatePeriod="2021 Jul 04" />
<ChartCanvas1 EncounterNbr="181296" Room="Artis Q-Rm 2" Patient_x0020_Type="Inpatient" DoS="2021-07-04T00:00:00-04:00" EStatus="Late" BarColor="#c20555" DatePeriod="2021 Jul 04" />
<ChartCanvas1 EncounterNbr="181297" Room="Artis Q-Rm 2" Patient_x0020_Type="Outpatient" DoS="2021-07-04T00:00:00-04:00" EStatus="Late" BarColor="#c20555" DatePeriod="2021 Jul 04" />
<ChartCanvas1 EncounterNbr="174850" Room="Artis Q-Rm 2" Patient_x0020_Type="Outpatient" DoS="2021-07-04T00:00:00-04:00" EStatus="Late" BarColor="#c20555" DatePeriod="2021 Jul 04" />
<ChartCanvas1 EncounterNbr="181044" Room="Artis Q-Rm 2" Patient_x0020_Type="Outpatient" DoS="2021-07-04T00:00:00-04:00" EStatus="Missing" BarColor="#fc9c04" DatePeriod="2021 Jul 04" />
<ChartCanvas1 EncounterNbr="181053" Room="Artis Q-Rm 2" Patient_x0020_Type="Inpatient" DoS="2021-07-04T00:00:00-04:00" EStatus="Late" BarColor="#c20555" DatePeriod="2021 Jul 04" />
<ChartCanvas1 EncounterNbr="171961" Room="Artis Q-Rm 2" Patient_x0020_Type="Outpatient" DoS="2021-07-04T00:00:00-04:00" EStatus="Late" BarColor="#c20555" DatePeriod="2021 Jul 04" />
<ChartCanvas1 EncounterNbr="181079" Room="Artis Q-Rm 2" Patient_x0020_Type="Outpatient" DoS="2021-07-04T00:00:00-04:00" EStatus="Missing" BarColor="#fc9c04" DatePeriod="2021 Jul 04" />
<ChartCanvas1 EncounterNbr="181078" Room="Artis Q-Rm 2" Patient_x0020_Type="Outpatient" DoS="2021-07-04T00:00:00-04:00" EStatus="Late" BarColor="#c20555" DatePeriod="2021 Jul 04" />
<ChartCanvas1 EncounterNbr="179847" Room="Artis Q-Rm 2" Patient_x0020_Type="Outpatient" DoS="2021-07-04T00:00:00-04:00" EStatus="Late" BarColor="#c20555" DatePeriod="2021 Jul 04" />
<ChartCanvas1 EncounterNbr="180533" Room="Artis Q-Rm 2" Patient_x0020_Type="Outpatient" DoS="2021-07-04T00:00:00-04:00" EStatus="On-Time" BarColor="#09d309" DatePeriod="2021 Jul 04" />
<ChartCanvas1 EncounterNbr="180859" Room="Artis Q-Rm 2" Patient_x0020_Type="Outpatient" DoS="2021-07-04T00:00:00-04:00" EStatus="Missing" BarColor="#fc9c04" DatePeriod="2021 Jul 04" />
<ChartCanvas1 EncounterNbr="178928" Room="Artis Q-Rm 2" Patient_x0020_Type="Outpatient" DoS="2021-07-04T00:00:00-04:00" EStatus="Late" BarColor="#c20555" DatePeriod="2021 Jul 04" />
<ChartCanvas1 EncounterNbr="181150" Room="Artis Q-Rm 2" Patient_x0020_Type="Outpatient" DoS="2021-07-04T00:00:00-04:00" EStatus="Late" BarColor="#c20555" DatePeriod="2021 Jul 04" />
<ChartCanvas1 EncounterNbr="180816" Room="Artis Q-Rm 2" Patient_x0020_Type="Outpatient" DoS="2021-07-11T00:00:00-04:00" EStatus="Missing" BarColor="#fc9c04" DatePeriod="2021 Jul 11" />
<ChartCanvas1 EncounterNbr="180874" Room="Artis Q-Rm 2" Patient_x0020_Type="Inpatient" DoS="2021-06-27T00:00:00-04:00" EStatus="On-Time" BarColor="#09d309" DatePeriod="2021 Jun 27" />
<ChartCanvas1 EncounterNbr="180291" Room="Artis Q-Rm 2" Patient_x0020_Type="Outpatient" DoS="2021-06-27T00:00:00-04:00" EStatus="Missing" BarColor="#fc9c04" DatePeriod="2021 Jun 27" />
<ChartCanvas1 EncounterNbr="180512" Room="Artis Q-Rm 2" Patient_x0020_Type="Outpatient" DoS="2021-06-27T00:00:00-04:00" EStatus="On-Time" BarColor="#09d309" DatePeriod="2021 Jun 27" />
<ChartCanvas1 EncounterNbr="180255" Room="Artis Q-Rm 2" Patient_x0020_Type="Outpatient" DoS="2021-06-27T00:00:00-04:00" EStatus="Late" BarColor="#c20555" DatePeriod="2021 Jun 27" />
<ChartCanvas1 EncounterNbr="180901" Room="Artis Q-Rm 2" Patient_x0020_Type="Inpatient" DoS="2021-06-27T00:00:00-04:00" EStatus="Late" BarColor="#c20555" DatePeriod="2021 Jun 27" />
<ChartCanvas1 EncounterNbr="180909" Room="Artis Q-Rm 2" Patient_x0020_Type="Inpatient" DoS="2021-06-27T00:00:00-04:00" EStatus="On-Time" BarColor="#09d309" DatePeriod="2021 Jun 27" />
<ChartCanvas1 EncounterNbr="180446" Room="Artis Q-Rm 2" Patient_x0020_Type="Outpatient" DoS="2021-06-27T00:00:00-04:00" EStatus="Late" BarColor="#c20555" DatePeriod="2021 Jun 27" />
<ChartCanvas1 EncounterNbr="180917" Room="Artis Q-Rm 2" Patient_x0020_Type="Inpatient" DoS="2021-07-04T00:00:00-04:00" EStatus="Missing" BarColor="#fc9c04" DatePeriod="2021 Jul 04" />
<ChartCanvas1 EncounterNbr="180851" Room="Artis Q-Rm 2" Patient_x0020_Type="Outpatient" DoS="2021-06-27T00:00:00-04:00" EStatus="Missing" BarColor="#fc9c04" DatePeriod="2021 Jun 27" />
<ChartCanvas1 EncounterNbr="180943" Room="Artis Q-Rm 2" Patient_x0020_Type="Outpatient" DoS="2021-06-27T00:00:00-04:00" EStatus="Late" BarColor="#c20555" DatePeriod="2021 Jun 27" />
<ChartCanvas1 EncounterNbr="180964" Room="Artis Q-Rm 2" Patient_x0020_Type="Inpatient" DoS="2021-07-04T00:00:00-04:00" EStatus="On-Time" BarColor="#09d309" DatePeriod="2021 Jul 04" />
<ChartCanvas1 EncounterNbr="180931" Room="Artis Q-Rm 2" Patient_x0020_Type="Outpatient" DoS="2021-06-27T00:00:00-04:00" EStatus="On-Time" BarColor="#09d309" DatePeriod="2021 Jun 27" />
<ChartCanvas1 EncounterNbr="180996" Room="Artis Q-Rm 2" Patient_x0020_Type="Outpatient" DoS="2021-06-27T00:00:00-04:00" EStatus="Late" BarColor="#c20555" DatePeriod="2021 Jun 27" />
<ChartCanvas1 EncounterNbr="180741" Room="Artis Q-Rm 2" Patient_x0020_Type="Outpatient" DoS="2021-07-04T00:00:00-04:00" EStatus="Late" BarColor="#c20555" DatePeriod="2021 Jul 04" />
<ChartCanvas1 EncounterNbr="180998" Room="Artis Q-Rm 2" Patient_x0020_Type="Outpatient" DoS="2021-07-04T00:00:00-04:00" EStatus="Late" BarColor="#c20555" DatePeriod="2021 Jul 04" />
<ChartCanvas1 EncounterNbr="180650" Room="Artis Q-Rm 2" Patient_x0020_Type="Inpatient" DoS="2021-07-04T00:00:00-04:00" EStatus="Late" BarColor="#c20555" DatePeriod="2021 Jul 04" />
<ChartCanvas1 EncounterNbr="179379" Room="Artis Q-Rm 2" Patient_x0020_Type="Outpatient" DoS="2021-07-04T00:00:00-04:00" EStatus="On-Time" BarColor="#09d309" DatePeriod="2021 Jul 04" />
<ChartCanvas1 EncounterNbr="180220" Room="Artis Q-Rm 2" Patient_x0020_Type="Outpatient" DoS="2021-06-27T00:00:00-04:00" EStatus="On-Time" BarColor="#09d309" DatePeriod="2021 Jun 27" />
<ChartCanvas1 EncounterNbr="179944" Room="Artis Q-Rm 2" Patient_x0020_Type="Outpatient" DoS="2021-07-04T00:00:00-04:00" EStatus="Late" BarColor="#c20555" DatePeriod="2021 Jul 04" />
<ChartCanvas1 EncounterNbr="179750" Room="Artis Q-Rm 2" Patient_x0020_Type="Outpatient" DoS="2021-07-04T00:00:00-04:00" EStatus="Late" BarColor="#c20555" DatePeriod="2021 Jul 04" />
<ChartCanvas1 EncounterNbr="176905" Room="Artis Q-Rm 2" Patient_x0020_Type="Outpatient" DoS="2021-07-04T00:00:00-04:00" EStatus="Missing" BarColor="#fc9c04" DatePeriod="2021 Jul 04" />
<ChartCanvas1 EncounterNbr="180162" Room="Artis Q-Rm 2" Patient_x0020_Type="Outpatient" DoS="2021-06-27T00:00:00-04:00" EStatus="Late" BarColor="#c20555" DatePeriod="2021 Jun 27" />
<ChartCanvas1 EncounterNbr="180163" Room="Artis Q-Rm 2" Patient_x0020_Type="Outpatient" DoS="2021-06-27T00:00:00-04:00" EStatus="Missing" BarColor="#fc9c04" DatePeriod="2021 Jun 27" />
<ChartCanvas1 EncounterNbr="180246" Room="Artis Q-Rm 2" Patient_x0020_Type="Outpatient" DoS="2021-06-27T00:00:00-04:00" EStatus="On-Time" BarColor="#09d309" DatePeriod="2021 Jun 27" />
<ChartCanvas1 EncounterNbr="180453" Room="Artis Q-Rm 2" Patient_x0020_Type="Outpatient" DoS="2021-06-27T00:00:00-04:00" EStatus="Late" BarColor="#c20555" DatePeriod="2021 Jun 27" />
<ChartCanvas1 EncounterNbr="170550" Room="Artis Q-Rm 2" Patient_x0020_Type="Outpatient" DoS="2021-06-27T00:00:00-04:00" EStatus="Missing" BarColor="#fc9c04" DatePeriod="2021 Jun 27" />
<ChartCanvas1 EncounterNbr="180303" Room="Artis Q-Rm 2" Patient_x0020_Type="Outpatient" DoS="2021-06-27T00:00:00-04:00" EStatus="Late" BarColor="#c20555" DatePeriod="2021 Jun 27" />
<ChartCanvas1 EncounterNbr="180270" Room="Artis Q-Rm 2" Patient_x0020_Type="Outpatient" DoS="2021-06-27T00:00:00-04:00" EStatus="Missing" BarColor="#fc9c04" DatePeriod="2021 Jun 27" />
<ChartCanvas1 EncounterNbr="180760" Room="Artis Q-Rm 2" Patient_x0020_Type="Outpatient" DoS="2021-06-27T00:00:00-04:00" EStatus="Missing" BarColor="#fc9c04" DatePeriod="2021 Jun 27" />
<ChartCanvas1 EncounterNbr="180766" Room="Artis Q-Rm 2" Patient_x0020_Type="Outpatient" DoS="2021-06-27T00:00:00-04:00" EStatus="Late" BarColor="#c20555" DatePeriod="2021 Jun 27" />
<ChartCanvas1 EncounterNbr="180781" Room="Artis Q-Rm 2" Patient_x0020_Type="Outpatient" DoS="2021-06-27T00:00:00-04:00" EStatus="Late" BarColor="#c20555" DatePeriod="2021 Jun 27" />
<ChartCanvas1 EncounterNbr="180015" Room="Artis Q-Rm 2" Patient_x0020_Type="Outpatient" DoS="2021-06-27T00:00:00-04:00" EStatus="Late" BarColor="#c20555" DatePeriod="2021 Jun 27" />
<ChartCanvas1 EncounterNbr="178700" Room="Artis Q-Rm 2" Patient_x0020_Type="Outpatient" DoS="2021-06-27T00:00:00-04:00" EStatus="On-Time" BarColor="#09d309" DatePeriod="2021 Jun 27" />
<ChartCanvas1 EncounterNbr="180569" Room="Artis Q-Rm 2" Patient_x0020_Type="Outpatient" DoS="2021-06-27T00:00:00-04:00" EStatus="Late" BarColor="#c20555" DatePeriod="2021 Jun 27" />
<ChartCanvas1 EncounterNbr="170808" Room="Artis Q-Rm 2" Patient_x0020_Type="Outpatient" DoS="2021-06-27T00:00:00-04:00" EStatus="Missing" BarColor="#fc9c04" DatePeriod="2021 Jun 27" />
<ChartCanvas1 EncounterNbr="180808" Room="Artis Q-Rm 2" Patient_x0020_Type="Inpatient" DoS="2021-06-27T00:00:00-04:00" EStatus="Missing" BarColor="#fc9c04" DatePeriod="2021 Jun 27" />
<ChartCanvas1 EncounterNbr="180820" Room="Artis Q-Rm 2" Patient_x0020_Type="Outpatient" DoS="2021-06-27T00:00:00-04:00" EStatus="Late" BarColor="#c20555" DatePeriod="2021 Jun 27" />
<ChartCanvas1 EncounterNbr="181305" Room="Artis Q-Rm 2" Patient_x0020_Type="Outpatient" DoS="2021-07-11T00:00:00-04:00" EStatus="Missing" BarColor="#fc9c04" DatePeriod="2021 Jul 11" />
<ChartCanvas1 EncounterNbr="179748" Room="Artis Q-Rm 2" Patient_x0020_Type="Outpatient" DoS="2021-07-11T00:00:00-04:00" EStatus="Missing" BarColor="#fc9c04" DatePeriod="2021 Jul 11" />
<ChartCanvas1 EncounterNbr="181803" Room="Artis Q-Rm 2" Patient_x0020_Type="Outpatient" DoS="2021-07-18T00:00:00-04:00" EStatus="Missing" BarColor="#fc9c04" DatePeriod="2021 Jul 18" />
<ChartCanvas1 EncounterNbr="181729" Room="Artis Q-Rm 2" Patient_x0020_Type="Outpatient" DoS="2021-07-11T00:00:00-04:00" EStatus="Missing" BarColor="#fc9c04" DatePeriod="2021 Jul 11" />
<ChartCanvas1 EncounterNbr="174444" Room="Artis Q-Rm 2" Patient_x0020_Type="Outpatient" DoS="2021-07-11T00:00:00-04:00" EStatus="Missing" BarColor="#fc9c04" DatePeriod="2021 Jul 11" />
<ChartCanvas1 EncounterNbr="181978" Room="Artis Q-Rm 2" Patient_x0020_Type="Outpatient" DoS="2021-07-18T00:00:00-04:00" EStatus="Missing" BarColor="#fc9c04" DatePeriod="2021 Jul 18" />
<ChartCanvas1 EncounterNbr="181884" Room="Artis Q-Rm 2" Patient_x0020_Type="Outpatient" DoS="2021-07-18T00:00:00-04:00" EStatus="Missing" BarColor="#fc9c04" DatePeriod="2021 Jul 18" />
<ChartCanvas1 EncounterNbr="181549" Room="Artis Q-Rm 2" Patient_x0020_Type="Outpatient" DoS="2021-07-11T00:00:00-04:00" EStatus="Missing" BarColor="#fc9c04" DatePeriod="2021 Jul 11" />
<ChartCanvas1 EncounterNbr="181970" Room="Artis Q-Rm 2" Patient_x0020_Type="Outpatient" DoS="2021-07-11T00:00:00-04:00" EStatus="Missing" BarColor="#fc9c04" DatePeriod="2021 Jul 11" />
<ChartCanvas1 EncounterNbr="176294" Room="Artis Q-Rm 2" Patient_x0020_Type="Outpatient" DoS="2021-07-11T00:00:00-04:00" EStatus="Missing" BarColor="#fc9c04" DatePeriod="2021 Jul 11" />
<ChartCanvas1 EncounterNbr="173589" Room="Artis Q-Rm 2" Patient_x0020_Type="Outpatient" DoS="2021-07-11T00:00:00-04:00" EStatus="Missing" BarColor="#fc9c04" DatePeriod="2021 Jul 11" />
<ChartCanvas1 EncounterNbr="181976" Room="Artis Q-Rm 2" Patient_x0020_Type="Outpatient" DoS="2021-07-18T00:00:00-04:00" EStatus="Missing" BarColor="#fc9c04" DatePeriod="2021 Jul 18" />
<ChartCanvas1 EncounterNbr="181773" Room="Artis Q-Rm 2" Patient_x0020_Type="Outpatient" DoS="2021-07-25T00:00:00-04:00" EStatus="Missing" BarColor="#fc9c04" DatePeriod="2021 Jul 25" />
<ChartCanvas1 EncounterNbr="181916" Room="Artis Q-Rm 2" Patient_x0020_Type="Outpatient" DoS="2021-07-18T00:00:00-04:00" EStatus="Missing" BarColor="#fc9c04" DatePeriod="2021 Jul 18" />
<ChartCanvas1 EncounterNbr="180969" Room="Artis Q-Rm 2" Patient_x0020_Type="Outpatient" DoS="2021-06-27T00:00:00-04:00" EStatus="Missing" BarColor="#fc9c04" DatePeriod="2021 Jun 27" />
<ChartCanvas1 EncounterNbr="179017" Room="Artis Q-Rm 2" Patient_x0020_Type="Outpatient" DoS="2021-07-25T00:00:00-04:00" EStatus="Missing" BarColor="#fc9c04" DatePeriod="2021 Jul 25" />
<ChartCanvas1 EncounterNbr="180594" Room="Artis Q-Rm 2" Patient_x0020_Type="Outpatient" DoS="2021-07-11T00:00:00-04:00" EStatus="Missing" BarColor="#fc9c04" DatePeriod="2021 Jul 11" />
<ChartCanvas1 EncounterNbr="176292" Room="Artis Q-Rm 2" Patient_x0020_Type="Outpatient" DoS="2021-07-11T00:00:00-04:00" EStatus="Missing" BarColor="#fc9c04" DatePeriod="2021 Jul 11" />
<ChartCanvas1 EncounterNbr="180749" Room="Artis Q-Rm 2" Patient_x0020_Type="Outpatient" DoS="2021-07-18T00:00:00-04:00" EStatus="Missing" BarColor="#fc9c04" DatePeriod="2021 Jul 18" />
<ChartCanvas1 EncounterNbr="172325" Room="Artis Q-Rm 2" Patient_x0020_Type="Outpatient" DoS="2021-07-18T00:00:00-04:00" EStatus="Missing" BarColor="#fc9c04" DatePeriod="2021 Jul 18" />
<ChartCanvas1 EncounterNbr="179387" Room="Artis Q-Rm 2" Patient_x0020_Type="Outpatient" DoS="2021-07-18T00:00:00-04:00" EStatus="Missing" BarColor="#fc9c04" DatePeriod="2021 Jul 18" />
<ChartCanvas1 EncounterNbr="181880" Room="Artis Q-Rm 2" Patient_x0020_Type="Outpatient" DoS="2021-07-18T00:00:00-04:00" EStatus="Missing" BarColor="#fc9c04" DatePeriod="2021 Jul 18" />
<ChartCanvas1 EncounterNbr="181364" Room="CT" Patient_x0020_Type="Outpatient" DoS="2021-07-11T00:00:00-04:00" EStatus="Missing" BarColor="#fc9c04" DatePeriod="2021 Jul 11" />
<ChartCanvas1 EncounterNbr="181402" Room="CT" Patient_x0020_Type="Outpatient" DoS="2021-07-11T00:00:00-04:00" EStatus="Missing" BarColor="#fc9c04" DatePeriod="2021 Jul 11" />
<ChartCanvas1 EncounterNbr="181401" Room="CT" Patient_x0020_Type="Outpatient" DoS="2021-07-11T00:00:00-04:00" EStatus="Missing" BarColor="#fc9c04" DatePeriod="2021 Jul 11" />
<ChartCanvas1 EncounterNbr="181482" Room="CT" Patient_x0020_Type="Outpatient" DoS="2021-07-11T00:00:00-04:00" EStatus="Missing" BarColor="#fc9c04" DatePeriod="2021 Jul 11" />
<ChartCanvas1 EncounterNbr="181763" Room="CT" Patient_x0020_Type="Inpatient" DoS="2021-07-11T00:00:00-04:00" EStatus="Late" BarColor="#c20555" DatePeriod="2021 Jul 11" />
<ChartCanvas1 EncounterNbr="178150" Room="CT" Patient_x0020_Type="Outpatient" DoS="2021-07-11T00:00:00-04:00" EStatus="Missing" BarColor="#fc9c04" DatePeriod="2021 Jul 11" />
<ChartCanvas1 EncounterNbr="181749" Room="CT" Patient_x0020_Type="Outpatient" DoS="2021-07-11T00:00:00-04:00" EStatus="Missing" BarColor="#fc9c04" DatePeriod="2021 Jul 11" />
<ChartCanvas1 EncounterNbr="181751" Room="CT" Patient_x0020_Type="Outpatient" DoS="2021-07-11T00:00:00-04:00" EStatus="Late" BarColor="#c20555" DatePeriod="2021 Jul 11" />
<ChartCanvas1 EncounterNbr="181885" Room="CT" Patient_x0020_Type="Inpatient" DoS="2021-07-11T00:00:00-04:00" EStatus="Missing" BarColor="#fc9c04" DatePeriod="2021 Jul 11" />
<ChartCanvas1 EncounterNbr="181612" Room="CT" Patient_x0020_Type="Outpatient" DoS="2021-07-11T00:00:00-04:00" EStatus="Missing" BarColor="#fc9c04" DatePeriod="2021 Jul 11" />
<ChartCanvas1 EncounterNbr="181625" Room="CT" Patient_x0020_Type="Inpatient" DoS="2021-07-11T00:00:00-04:00" EStatus="Late" BarColor="#c20555" DatePeriod="2021 Jul 11" />
<ChartCanvas1 EncounterNbr="181635" Room="CT" Patient_x0020_Type="Outpatient" DoS="2021-07-11T00:00:00-04:00" EStatus="Missing" BarColor="#fc9c04" DatePeriod="2021 Jul 11" />
<ChartCanvas1 EncounterNbr="181713" Room="CT" Patient_x0020_Type="Inpatient" DoS="2021-07-11T00:00:00-04:00" EStatus="Late" BarColor="#c20555" DatePeriod="2021 Jul 11" />
<ChartCanvas1 EncounterNbr="181712" Room="CT" Patient_x0020_Type="Inpatient" DoS="2021-07-11T00:00:00-04:00" EStatus="Late" BarColor="#c20555" DatePeriod="2021 Jul 11" />
<ChartCanvas1 EncounterNbr="181169" Room="CT" Patient_x0020_Type="Outpatient" DoS="2021-07-11T00:00:00-04:00" EStatus="Late" BarColor="#c20555" DatePeriod="2021 Jul 11" />
<ChartCanvas1 EncounterNbr="181721" Room="CT" Patient_x0020_Type="Inpatient" DoS="2021-07-11T00:00:00-04:00" EStatus="Late" BarColor="#c20555" DatePeriod="2021 Jul 11" />
<ChartCanvas1 EncounterNbr="180390" Room="CT" Patient_x0020_Type="Outpatient" DoS="2021-07-11T00:00:00-04:00" EStatus="Missing" BarColor="#fc9c04" DatePeriod="2021 Jul 11" />
<ChartCanvas1 EncounterNbr="181724" Room="CT" Patient_x0020_Type="Inpatient" DoS="2021-07-11T00:00:00-04:00" EStatus="Missing" BarColor="#fc9c04" DatePeriod="2021 Jul 11" />
<ChartCanvas1 EncounterNbr="181737" Room="CT" Patient_x0020_Type="Inpatient" DoS="2021-07-11T00:00:00-04:00" EStatus="On-Time" BarColor="#09d309" DatePeriod="2021 Jul 11" />
<ChartCanvas1 EncounterNbr="180693" Room="CT" Patient_x0020_Type="Outpatient" DoS="2021-07-11T00:00:00-04:00" EStatus="Missing" BarColor="#fc9c04" DatePeriod="2021 Jul 11" />
<ChartCanvas1 EncounterNbr="179415" Room="CT" Patient_x0020_Type="Outpatient" DoS="2021-07-11T00:00:00-04:00" EStatus="Late" BarColor="#c20555" DatePeriod="2021 Jul 11" />
<ChartCanvas1 EncounterNbr="180417" Room="CT" Patient_x0020_Type="Outpatient" DoS="2021-07-11T00:00:00-04:00" EStatus="Late" BarColor="#c20555" DatePeriod="2021 Jul 11" />
<ChartCanvas1 EncounterNbr="180414" Room="CT" Patient_x0020_Type="Outpatient" DoS="2021-07-11T00:00:00-04:00" EStatus="Late" BarColor="#c20555" DatePeriod="2021 Jul 11" />
<ChartCanvas1 EncounterNbr="179416" Room="CT" Patient_x0020_Type="Outpatient" DoS="2021-07-11T00:00:00-04:00" EStatus="Missing" BarColor="#fc9c04" DatePeriod="2021 Jul 11" />
<ChartCanvas1 EncounterNbr="181123" Room="CT" Patient_x0020_Type="Outpatient" DoS="2021-07-11T00:00:00-04:00" EStatus="Late" BarColor="#c20555" DatePeriod="2021 Jul 11" />
<ChartCanvas1 EncounterNbr="181122" Room="CT" Patient_x0020_Type="Outpatient" DoS="2021-07-11T00:00:00-04:00" EStatus="Missing" BarColor="#fc9c04" DatePeriod="2021 Jul 11" />
<ChartCanvas1 EncounterNbr="181325" Room="CT" Patient_x0020_Type="Outpatient" DoS="2021-07-11T00:00:00-04:00" EStatus="Late" BarColor="#c20555" DatePeriod="2021 Jul 11" />
<ChartCanvas1 EncounterNbr="181322" Room="CT" Patient_x0020_Type="Outpatient" DoS="2021-07-11T00:00:00-04:00" EStatus="Missing" BarColor="#fc9c04" DatePeriod="2021 Jul 11" />
<ChartCanvas1 EncounterNbr="181318" Room="CT" Patient_x0020_Type="Outpatient" DoS="2021-07-11T00:00:00-04:00" EStatus="Missing" BarColor="#fc9c04" DatePeriod="2021 Jul 11" />
<ChartCanvas1 EncounterNbr="181321" Room="CT" Patient_x0020_Type="Outpatient" DoS="2021-07-11T00:00:00-04:00" EStatus="Missing" BarColor="#fc9c04" DatePeriod="2021 Jul 11" />
<ChartCanvas1 EncounterNbr="181073" Room="CT" Patient_x0020_Type="Outpatient" DoS="2021-07-04T00:00:00-04:00" EStatus="Late" BarColor="#c20555" DatePeriod="2021 Jul 04" />
<ChartCanvas1 EncounterNbr="181072" Room="CT" Patient_x0020_Type="Outpatient" DoS="2021-07-04T00:00:00-04:00" EStatus="Late" BarColor="#c20555" DatePeriod="2021 Jul 04" />
<ChartCanvas1 EncounterNbr="181500" Room="CT" Patient_x0020_Type="Outpatient" DoS="2021-07-04T00:00:00-04:00" EStatus="Missing" BarColor="#fc9c04" DatePeriod="2021 Jul 04" />
<ChartCanvas1 EncounterNbr="181074" Room="CT" Patient_x0020_Type="Outpatient" DoS="2021-07-04T00:00:00-04:00" EStatus="On-Time" BarColor="#09d309" DatePeriod="2021 Jul 04" />
<ChartCanvas1 EncounterNbr="181506" Room="CT" Patient_x0020_Type="Outpatient" DoS="2021-07-04T00:00:00-04:00" EStatus="Missing" BarColor="#fc9c04" DatePeriod="2021 Jul 04" />
<ChartCanvas1 EncounterNbr="181095" Room="CT" Patient_x0020_Type="Outpatient" DoS="2021-07-11T00:00:00-04:00" EStatus="Late" BarColor="#c20555" DatePeriod="2021 Jul 11" />
<ChartCanvas1 EncounterNbr="179664" Room="CT" Patient_x0020_Type="Outpatient" DoS="2021-07-11T00:00:00-04:00" EStatus="Late" BarColor="#c20555" DatePeriod="2021 Jul 11" />
<ChartCanvas1 EncounterNbr="181372" Room="CT" Patient_x0020_Type="Outpatient" DoS="2021-07-11T00:00:00-04:00" EStatus="Late" BarColor="#c20555" DatePeriod="2021 Jul 11" />
<ChartCanvas1 EncounterNbr="180701" Room="CT" Patient_x0020_Type="Outpatient" DoS="2021-07-11T00:00:00-04:00" EStatus="Late" BarColor="#c20555" DatePeriod="2021 Jul 11" />
<ChartCanvas1 EncounterNbr="181586" Room="CT" Patient_x0020_Type="Outpatient" DoS="2021-07-11T00:00:00-04:00" EStatus="Late" BarColor="#c20555" DatePeriod="2021 Jul 11" />
<ChartCanvas1 EncounterNbr="178179" Room="CT" Patient_x0020_Type="Outpatient" DoS="2021-07-11T00:00:00-04:00" EStatus="Late" BarColor="#c20555" DatePeriod="2021 Jul 11" />
<ChartCanvas1 EncounterNbr="180915" Room="CT" Patient_x0020_Type="Outpatient" DoS="2021-07-04T00:00:00-04:00" EStatus="On-Time" BarColor="#09d309" DatePeriod="2021 Jul 04" />
<ChartCanvas1 EncounterNbr="181363" Room="CT" Patient_x0020_Type="Inpatient" DoS="2021-07-04T00:00:00-04:00" EStatus="Late" BarColor="#c20555" DatePeriod="2021 Jul 04" />
<ChartCanvas1 EncounterNbr="181365" Room="CT" Patient_x0020_Type="Inpatient" DoS="2021-07-04T00:00:00-04:00" EStatus="Late" BarColor="#c20555" DatePeriod="2021 Jul 04" />
<ChartCanvas1 EncounterNbr="180432" Room="CT" Patient_x0020_Type="Outpatient" DoS="2021-07-04T00:00:00-04:00" EStatus="Missing" BarColor="#fc9c04" DatePeriod="2021 Jul 04" />
<ChartCanvas1 EncounterNbr="180697" Room="CT" Patient_x0020_Type="Outpatient" DoS="2021-07-04T00:00:00-04:00" EStatus="Missing" BarColor="#fc9c04" DatePeriod="2021 Jul 04" />
<ChartCanvas1 EncounterNbr="180698" Room="CT" Patient_x0020_Type="Outpatient" DoS="2021-07-04T00:00:00-04:00" EStatus="Missing" BarColor="#fc9c04" DatePeriod="2021 Jul 04" />
<ChartCanvas1 EncounterNbr="181414" Room="CT" Patient_x0020_Type="Inpatient" DoS="2021-07-04T00:00:00-04:00" EStatus="Late" BarColor="#c20555" DatePeriod="2021 Jul 04" />
<ChartCanvas1 EncounterNbr="180932" Room="CT" Patient_x0020_Type="Outpatient" DoS="2021-07-04T00:00:00-04:00" EStatus="Late" BarColor="#c20555" DatePeriod="2021 Jul 04" />
<ChartCanvas1 EncounterNbr="181128" Room="CT" Patient_x0020_Type="Outpatient" DoS="2021-07-04T00:00:00-04:00" EStatus="Late" BarColor="#c20555" DatePeriod="2021 Jul 04" />
<ChartCanvas1 EncounterNbr="181012" Room="CT" Patient_x0020_Type="Outpatient" DoS="2021-07-04T00:00:00-04:00" EStatus="Late" BarColor="#c20555" DatePeriod="2021 Jul 04" />
<ChartCanvas1 EncounterNbr="180933" Room="CT" Patient_x0020_Type="Outpatient" DoS="2021-07-04T00:00:00-04:00" EStatus="Late" BarColor="#c20555" DatePeriod="2021 Jul 04" />
<ChartCanvas1 EncounterNbr="181011" Room="CT" Patient_x0020_Type="Outpatient" DoS="2021-07-04T00:00:00-04:00" EStatus="Late" BarColor="#c20555" DatePeriod="2021 Jul 04" />
<ChartCanvas1 EncounterNbr="181189" Room="CT" Patient_x0020_Type="Outpatient" DoS="2021-07-04T00:00:00-04:00" EStatus="Late" BarColor="#c20555" DatePeriod="2021 Jul 04" />
<ChartCanvas1 EncounterNbr="179977" Room="CT" Patient_x0020_Type="Outpatient" DoS="2021-07-04T00:00:00-04:00" EStatus="Missing" BarColor="#fc9c04" DatePeriod="2021 Jul 04" />
<ChartCanvas1 EncounterNbr="181210" Room="CT" Patient_x0020_Type="Inpatient" DoS="2021-07-04T00:00:00-04:00" EStatus="Late" BarColor="#c20555" DatePeriod="2021 Jul 04" />
<ChartCanvas1 EncounterNbr="181096" Room="CT" Patient_x0020_Type="Outpatient" DoS="2021-07-04T00:00:00-04:00" EStatus="Late" BarColor="#c20555" DatePeriod="2021 Jul 04" />
<ChartCanvas1 EncounterNbr="180838" Room="CT" Patient_x0020_Type="Outpatient" DoS="2021-07-04T00:00:00-04:00" EStatus="On-Time" BarColor="#09d309" DatePeriod="2021 Jul 04" />
<ChartCanvas1 EncounterNbr="180840" Room="CT" Patient_x0020_Type="Outpatient" DoS="2021-07-04T00:00:00-04:00" EStatus="On-Time" BarColor="#09d309" DatePeriod="2021 Jul 04" />
<ChartCanvas1 EncounterNbr="181287" Room="CT" Patient_x0020_Type="Outpatient" DoS="2021-07-04T00:00:00-04:00" EStatus="Late" BarColor="#c20555" DatePeriod="2021 Jul 04" />
<ChartCanvas1 EncounterNbr="180913" Room="CT" Patient_x0020_Type="Outpatient" DoS="2021-07-04T00:00:00-04:00" EStatus="On-Time" BarColor="#09d309" DatePeriod="2021 Jul 04" />
<ChartCanvas1 EncounterNbr="180873" Room="CT" Patient_x0020_Type="Outpatient" DoS="2021-07-04T00:00:00-04:00" EStatus="On-Time" BarColor="#09d309" DatePeriod="2021 Jul 04" />
<ChartCanvas1 EncounterNbr="180656" Room="CT" Patient_x0020_Type="Outpatient" DoS="2021-07-04T00:00:00-04:00" EStatus="Missing" BarColor="#fc9c04" DatePeriod="2021 Jul 04" />
<ChartCanvas1 EncounterNbr="180875" Room="CT" Patient_x0020_Type="Outpatient" DoS="2021-07-04T00:00:00-04:00" EStatus="On-Time" BarColor="#09d309" DatePeriod="2021 Jul 04" />
<ChartCanvas1 EncounterNbr="181033" Room="CT" Patient_x0020_Type="Unspecified" DoS="2021-07-04T00:00:00-04:00" EStatus="Missing" BarColor="#fc9c04" DatePeriod="2021 Jul 04" />
<ChartCanvas1 EncounterNbr="181039" Room="CT" Patient_x0020_Type="Outpatient" DoS="2021-07-04T00:00:00-04:00" EStatus="Missing" BarColor="#fc9c04" DatePeriod="2021 Jul 04" />
<ChartCanvas1 EncounterNbr="181069" Room="CT" Patient_x0020_Type="Outpatient" DoS="2021-07-04T00:00:00-04:00" EStatus="On-Time" BarColor="#09d309" DatePeriod="2021 Jul 04" />
<ChartCanvas1 EncounterNbr="181080" Room="CT" Patient_x0020_Type="Outpatient" DoS="2021-07-11T00:00:00-04:00" EStatus="Late" BarColor="#c20555" DatePeriod="2021 Jul 11" />
<ChartCanvas1 EncounterNbr="179973" Room="CT" Patient_x0020_Type="Outpatient" DoS="2021-07-04T00:00:00-04:00" EStatus="Missing" BarColor="#fc9c04" DatePeriod="2021 Jul 04" />
</rdData>
-

Johnny,
As far as I know Logi hasn't exposed hierarchical categorization along the x-Axis. I actually think there is a Highcharts plugin that will provide exactly what you want, but it is not easy to implement.
The closest thing you will probably be able to get with Info out-of-the-box is to use a Crosstab chart with a Calculated column returning a concatenation of DatePeriod and Room used as the Label Column in the Crosstab Filter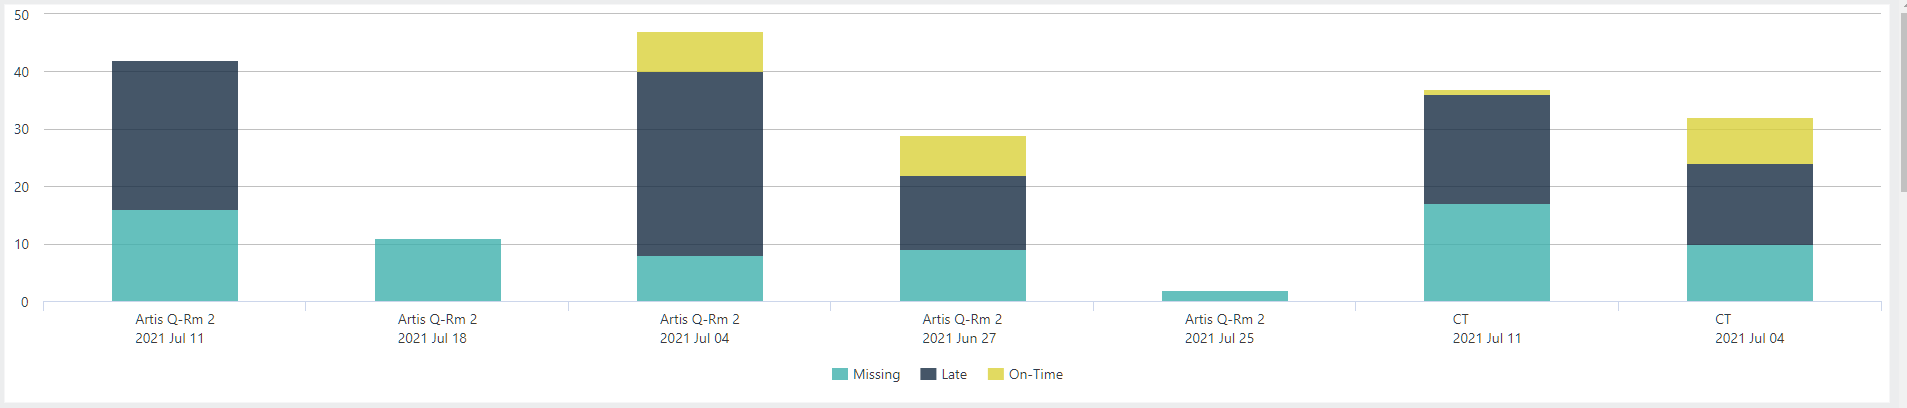
Your chart would be defined as follows:
<ChartCanvas>
<DataLayer Type="XMLFile" XMLFile="newXMLFile.xml" ID="ChartQuery">
<Remark>
<DataLayerLink ID="dllData" />
</Remark>
<CalculatedColumn Formula=""@Data.Room~<br>@Data.DatePeriod~"" ID="Room-Date" />
<CrosstabFilter CrosstabColumn="EStatus" CrosstabLabelColumn="Room-Date" CrosstabValueColumn="EncounterNbr" CrosstabValueFunction="DistinctCount" />
</DataLayer>
<Series Type="Bar" ChartYDataColumn="rdCrosstabValue" ChartXDataColumn="rdCrosstab" BarStacking="Stacked" />
<ChartXAxis>
<AxisLabelStyle Format="HTML" />
</ChartXAxis>
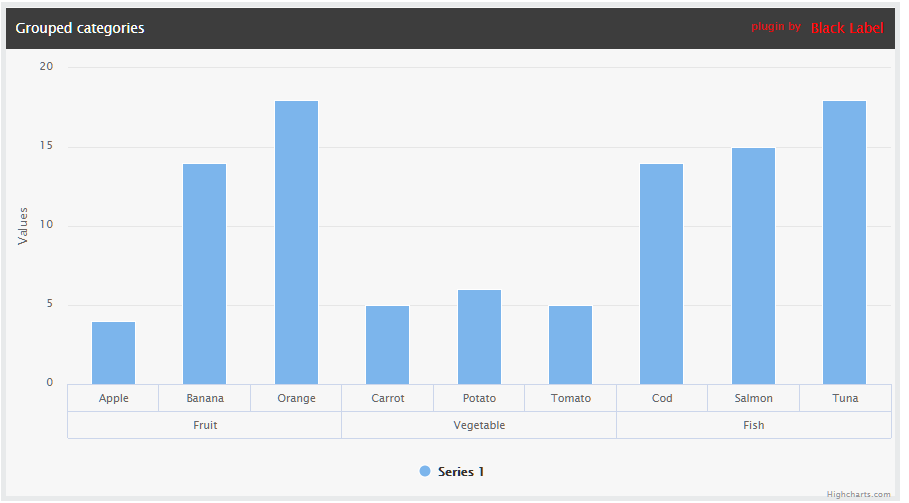
</ChartCanvas>I think this is what you are actually looking for: http://blacklabel.github.io/grouped_categories/
Where in this example the Fruit,Vegetable,Fish would be your Date Grouping then within each Date Group you would have your normal stacked bars for each room by EStatus.
 We could probably help you out some more if interested.
johns@visuidesign.com2 -

Wow... Another kick-#$s Solution from Sweazen!!
Shout out to VISUII'm going with a hybrid of your first recommendation where I'm concatenating DatePeriod+Room (but only showing Room in the Label) and a separate XAxis showing DatePeriod. The issue that I'm seeing is that the secondary XAxis (DatePeriod) is evenly spaced across the available DatePeriod values (width of chart divided by '5' in this case) while my DatePeriod+Room values in the primary XAxis is spaced based on the available data. This leaves the XAxes misaligned as you can see with TicksAndGrids added here. I need the XAxis for DatePeriod to show Gridlines after the last value in each DatePeriod+Room set, so it should fall after "Zeego-Rm1":
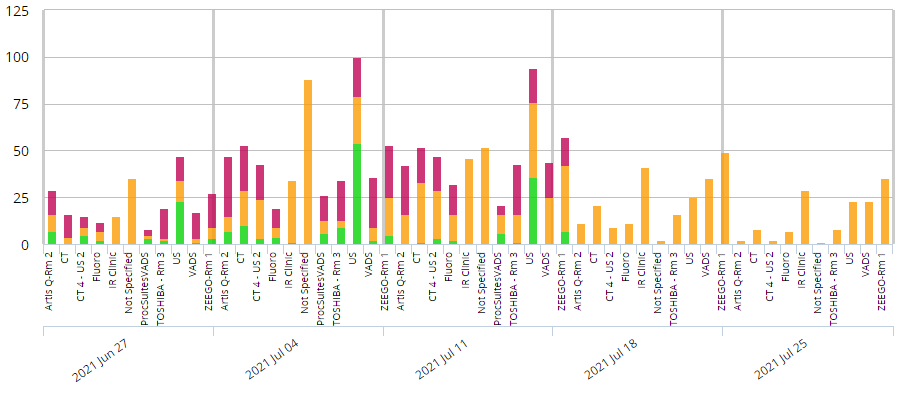
Any ideas on how to align these Axes more closely? There will regularly be situations in the data where the Rooms won't be so evenly spaced across DatePeriods; 11, 11, 11, 10, 10 in the above example could easily be 6, 1, 3, 1, 6 which would make the evenly spaced DateOverlay Axis even further off.
<ChartCanvas>
<Series Type="Bar" ChartYDataColumn="rdCrosstabValue" ChartXDataColumn="RoomNoDate" BarStacking="Stacked" Color="@Chart.rdCrosstabValue-BarColor~" ID="SeriesBarData" LinkedToXAxisID="BarData">
<DataLayer Type="XMLFile" XMLFile="OTEDataSortedByRoom.xml" ID="ChartQuery">
<CalculatedColumn Formula=""@Data.DatePeriod~ @Data.Room~"" ID="Date-Room" />
<SortFilter SortColumn="DoS,Room" />
<CrosstabFilter CrosstabColumn="EStatus" CrosstabLabelColumn="Date-Room" CrosstabValueColumn="EncounterNbr" CrosstabValueFunction="Count" ID="ctfGroupedData">
<ExtraCrosstabValueColumn CrosstabValueColumn="BarColor" CrosstabValueFunction="Any" ID="BarColor" />
<ExtraCrosstabLabelColumn CrosstabLabelColumn="Room" ID="RoomNoDate" />
</CrosstabFilter>
</DataLayer>
</Series>
<Series BarStacking="Overlay" ChartXDataColumn="DatePeriod" ChartYDataColumn="yval" Color="#FFF" LinkedToXAxisID="DateOverlay" Type="Bar" ID="SeriesDateOverlay" LegendLabel=" ">
<DataLayer ID="ChartQueryOverlay" Type="XMLFile" XMLFile="OTEDataSortedByRoom.xml">
<SortFilter DataType="Date" SortColumn="DoS" />
<CrosstabFilter CrosstabColumn="Room" CrosstabLabelColumn="DatePeriod" CrosstabValueColumn="EncounterNbr" CrosstabValueFunction="Count" ID="ctfGroupedOverlay" />
<CalculatedColumn Formula="0" ID="yval">
<Note Note="set the yAxis val to zero " />
</CalculatedColumn>
</DataLayer>
</Series>
<ChartXAxis ID="BarData">
<AxisLabelStyle FontAngle="90" FontSize="10" />
</ChartXAxis>
<ChartXAxis ID="DateOverlay">
<AxisLabelStyle FontAngle="35" FontSize="12" />
<ChartTicksAndGrid />
</ChartXAxis>
<ChartCanvasLegend LegendOrientation="Vertical" ReversedItemOrder="True" OffsetX="-10">
<LegendLabelStyle FontSize="12" />
</ChartCanvasLegend>
</ChartCanvas>Regards,
Johnny1 -
Hey John,
It occurred to me that this is a simple matter of getting the XAxis segments to align with the Count of Rooms per DatePeriod. The SeriesDateOverlay doesn't even need the CrosstabFilter... once we group by DatePeriod and get the Ct of Rooms per DatePeriod, we want the 'length' of each DatePeriod 'segment' on the XAxis to correspond to those values.
I have the following Bar.Series and XAxis for this:
<Series BarStacking="Overlay" ChartXDataColumn="DatePeriod" ChartYDataColumn="yval" Color="#FFF" LinkedToXAxisID="DateOverlay" Type="Bar" ID="SeriesDateOverlay" LegendLabel=" ">
<DataLayer ID="ChartQueryOverlay" Type="XMLFile" XMLFile="OTEDataSortedByRoom.xml">
<GroupFilter GroupColumn="DatePeriod" ID="grpDatePer">
<GroupAggregateColumn AggregateColumn="Room" AggregateFunction="DistinctCount" ID="ctRoomsPerPeriod" />
</GroupFilter>
<SortFilter DataType="Date" SortColumn="DoS" ID="sortDoS" />
<CalculatedColumn Formula="0" ID="yval">
<Note Note="set the yAxis val to zero " />
</CalculatedColumn>
</DataLayer>
</Series><ChartXAxis ID="DateOverlay">
<AxisLabelStyle FontAngle="35" FontSize="12" />
<Remark>
<ChartTicksAndGrid />
</Remark>
</ChartXAxis>How do I get the length of each DatePeriod segment of the XAxis to correspond to the ctRoomsPerPeriod value (using the earlier XML data - 11, 11, 11, 10, and 10 respectively)?
Thanks,
Johnny0 -
Just to keep everyone updated... we are contracting with VISUI and John Sweazen for this integration work.
0
Please sign in to leave a comment.
Comments
4 comments