Logi XOLAP - About Data Cubes
A data cube is a collection of data that allows analysis in multiple "dimensions".
Consider, for example, a spreadsheet. This is a classic arrangement of data in two dimensions: rows and columns. The intersection of a row and column provides us with a specific data value:
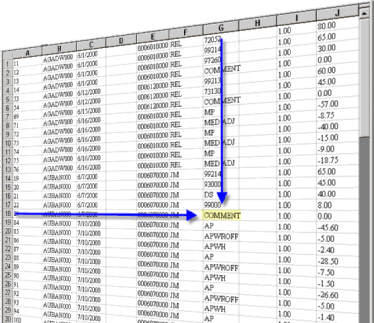
We can also use all of the column values along a single row or down a single column for comparison or summarization purposes. This row-column model also describes a database table.
Now, let's consider what happens when we "stack" several identically-formatted spreadsheets, one behind the other. If we pick a specific cell in the front sheet and "drill through" it, we can examine and compare the values for that one cell on all of the sheets. This is a "three-dimensional" comparison or summarization, and an example of how data can be arranged into a "cube". The drill-through provides a third dimension. This is particularly useful in comparing or summarizing data over time. The data cube, which is the foundation of Online Analytical Processing, or OLAP, is particularly useful in finding trends in very large amounts of data.
OLAP data cubes are usually marvels of data warehouse engineering, and
designing and implementing them is a time-consuming, complicated process.
Specialized database servers are often employed and queries made against
an OLAP cube use a special query syntax (MDX) that's similar, but notably
different, from that of standard SQL queries.
Logi Info includes OLAP elements that can issue these queries against cubes created using Microsoft SQL Server Analysis Services and the results can be viewed, aggregated, summarized, and visualized. Logi Info, however, does not create OLAP cubes. More information can be found in Logi OLAP.