The Formatted Column
The Formatted Column element is used with datalayer elements to add a new column, containing formatted data, to the datalayer and provides a significant performance improvement. This topic discusses use of this element;.
- About the Formatted Column Element
- Usage Examples
About the Formatted Column Element
The Formatted Column element is similar to other elements designed to extend the data available in a datalayer. Like the Calculated Column element, the Formatted Column is added as a child element beneath a datalayer and adds anew column to the datalayer at runtime. This new column contains formatted data which is accessible using an @Data token.
Formatting data in the datalayer is particularly useful when working with charts whose data attributes may not allow application of scripting functions or formats. In addition, Tooltips can also benefit from being able to use formatted data.
![]() Data in a Formatted Column may not be of the same data type as the column from which it is derived. For example, when a numeric column, with a value of 1234, is used to create a Formatted Column that applies the Currency format, the result will be string-type data: "$1,234.00". Thus, in this case, the Formatted Column is useful for chart axis labels, but may not
work for chart
data, which requires the original numeric value.
Data in a Formatted Column may not be of the same data type as the column from which it is derived. For example, when a numeric column, with a value of 1234, is used to create a Formatted Column that applies the Currency format, the result will be string-type data: "$1,234.00". Thus, in this case, the Formatted Column is useful for chart axis labels, but may not
work for chart
data, which requires the original numeric value.
The pre-configured format options available in the Formatted Column element are identical to the Format attribute value options in elements such as the Label. In addition, custom formatting can be entered manually.
For more information about formatting options and custom formats, see Format Data.
Dynamic Formatting
The Formatted Column element has an Include Condition attribute:
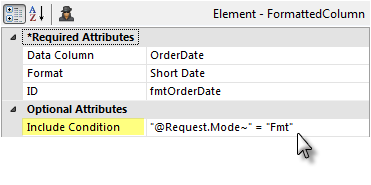
If the value of this attribute is left blank or contains a formula that evaluates to True, the element is applied to the datalayer. If the value evaluates to False, the element is ignored and does not affect the datalayer. This powerful feature allows you to dynamically determine if a new column of formatted data will be added to the datalayer or not.
Usage Examples
Let's look at some examples of common Formatted Column use-cases.

For each of the examples, imagine that the SQL query shown above has been used to retrieve data for a Data Table.
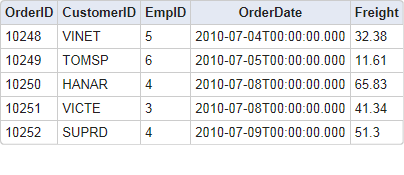
The data retrieved into the datalayer looks like the example shown above. Next, we'll add different kinds a formatted columns.
Format: Currency
It's often useful to apply the standard Currency format to monetary data.
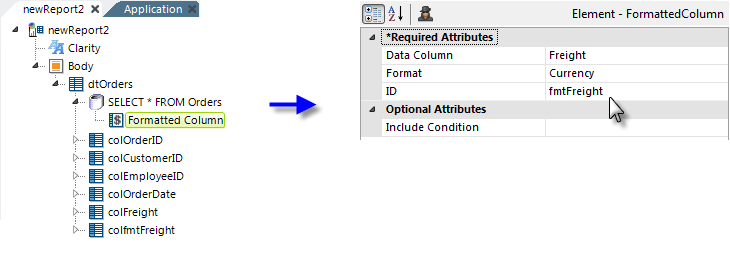
If we add a Formatted Column element beneath the datalayer, as shown above, set its attributes as shown, and provide another Data Table Column element to display the column added to the datalayer,
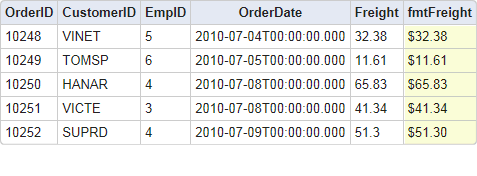
the output will change as shown above. In this case, the new column added to the datalayer contains the values from the Freight column, formatted as Currency.
Format: Short Date
Another common requirement is for date formatting. As we've seen in earlier output examples, the ISO format used to store DateTime values in many databases isn't very presentable.
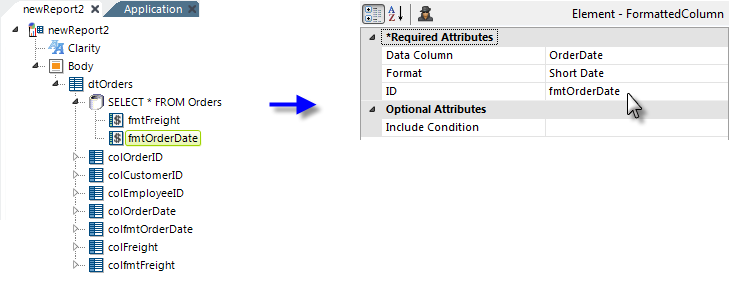
The example shown above illustrates how a Formatted Column element can be added to format dates using one of the standard date formats, Short Date,

and the resulting output is shown above.
Format: Month Abbreviations
It can be very useful, particularly when working with charts, to have a column that contains the month name abbreviation of a date value.
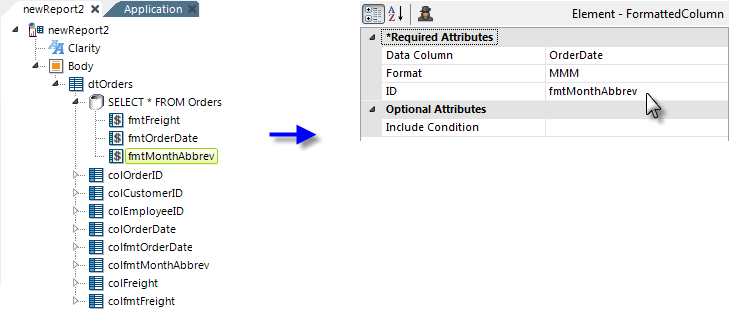
The example above shows how a custom format can be used; in this case the custom format value MMM will produce a 3-letter month abbreviation,

and the resulting output is shown above. Incidentally, a format value of MM will produce the month number and M will produce the month name and day ("July 15"). All of these format values must be in uppercase.
As mentioned earlier, formatting data in the datalayer is much more efficient than formatting it elsewhere, so using Formatted Column elements can speed up report performance.