Track 3: Creating Web Reports
Logi Report provides the web reporting solution that is aimed at easier and faster report creation and design, faster report execution, easier customization, and better presentation style using the newest Web technology. Web reports are viewed using a new interactive viewer called Web Report Studio, which provides a much nicer end user experience with many powerful features for interfacing with a report such as changing parameters without re-running the report.
In Designer, report developers can create, open, and edit web reports. Web reports created on Server can also be downloaded to Designer for further editing.
In this track, you will create a web report as the role of a report developer, based on the business view WorldWideSalesBV created in the previous track. The report will show each product's sales information, including order ID, order date, quantity, unit price, discount, and the total sales for each order. In order for end users to see sales information within a specific range, such as country or product name, you will also add filter controls for dynamically filtering the data according to their requirements.
This track contains the following tasks:
- Task 1: Create the Initial Report
- Task 2: Improve the Report Layout
- Task 3: Format the Report Components
- Task 4: Preview the Report in Web Report Studio
![]() A Live license for Designer is required in order to perform this track. If you do not have the license, please contact your Logi Analytics account manager to obtain it first.
A Live license for Designer is required in order to perform this track. If you do not have the license, please contact your Logi Analytics account manager to obtain it first.
Task 1: Create the Initial Report
- Select Logi Report Designer in the Logi Report folder on the Start menu to start Designer.
Designer displays the main window and shows the Start Page by default. Close the Start Page.
- Select File > Open Catalog.
- In the Open Catalog File dialog box, browse to select the JinfonetGourmetJava.cat catalog file in
<install_root>\Demo\Reports\JinfonetGourmetJava, then select the Open button.Designer displays the Catalog Manager. Close it since we will not use it in the lesson.
- Select File > New> Web Report. A blank web report with a one-cell tabular is created.
- Right-click the report body, select Split from the shortcut menu.
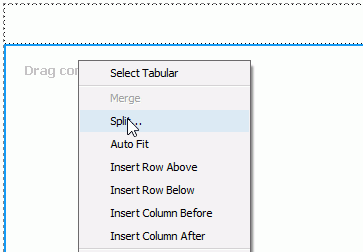
- In the Split Cell dialog box, set both numbers to 2, then select OK.
The report body is now hosted by four tabular cells. We will put the filter controls in the left cells, a chart and a table in the right cells. First we create a chart to demonstrate the total sales of each product.
- Select the right cell in the first tabular row, then select Insert > Chart. Designer displays the Create Chart dialog box.
- In the Data screen, select WorldWideSalesBV. Select Next.
- In the Type screen, keep the default chart type Clustered Bar 2-D and select Next.
- In the Display Screen, add Product Name in the Products category to the X-Axis box and Total Sales in the Orders Detail category to the Bar Length box.
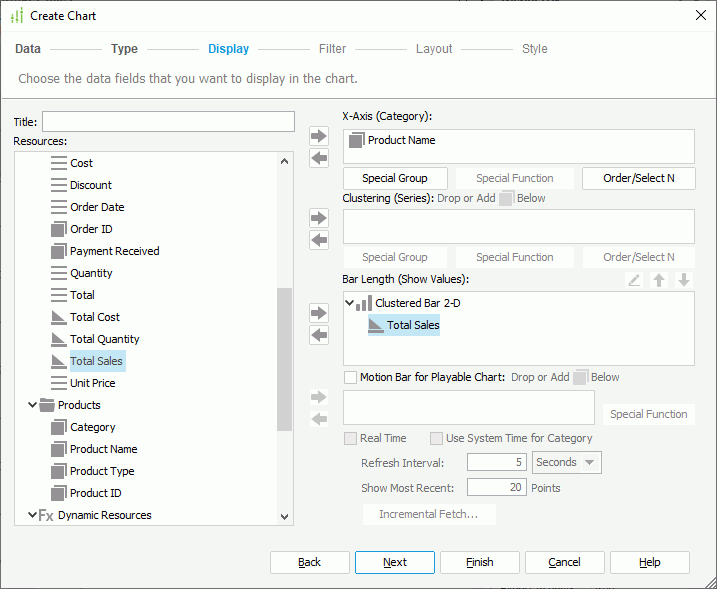
- Select Style to switch to the screen, select Classic as the chart style, then select Finish to create the chart.
Next, we will create a table to display the sales information just below the chart.
- Select the right cell in the second tabular row, then select Insert > Table. In the Table Type dialog box, keep the default selection and select OK. Designer displays the Create Table dialog box.
- In the Data screen, select WorldWideSalesBV and select Next.
- In the Display Screen, drag the following elements in the Orders Detail category to be displayed in the table one by one: Order ID, Order Date, Quantity, Unit Price, Discount, and Total. Select Next.
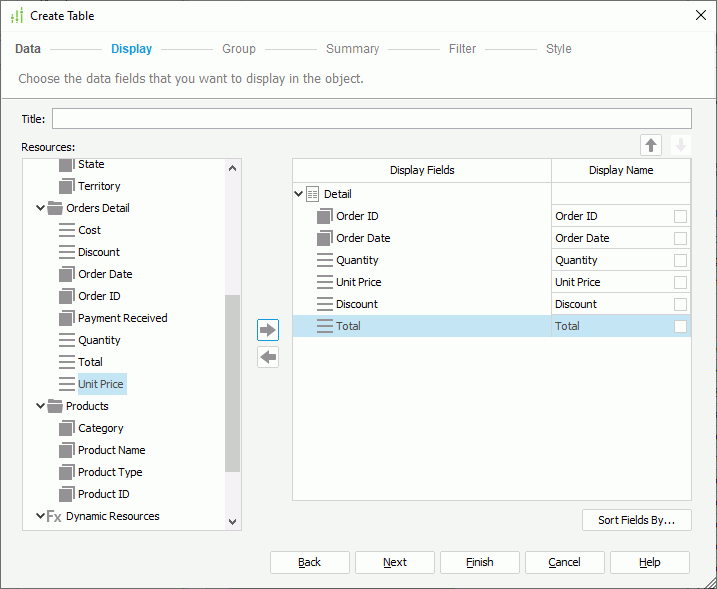
- In the Group screen, add Country and Product Name as the group-by fields (Country is the higher group level).
- Select Style to switch to the screen, then select BottleGreen as the table style.
- Select Finish to create the table.
We will add two filter controls to the report, so that at runtime end users can select one or more values in the filter controls to dynamically filter the chart and table.
- Select the first tabular cell, select Insert > Web Controls > Filter Control.
- In the Insert Filter Control dialog box, select Country from the Select Fields drop-down list, select outside of the field drop-down list in the dialog box to finish selecting field, then select OK to insert the filter control.
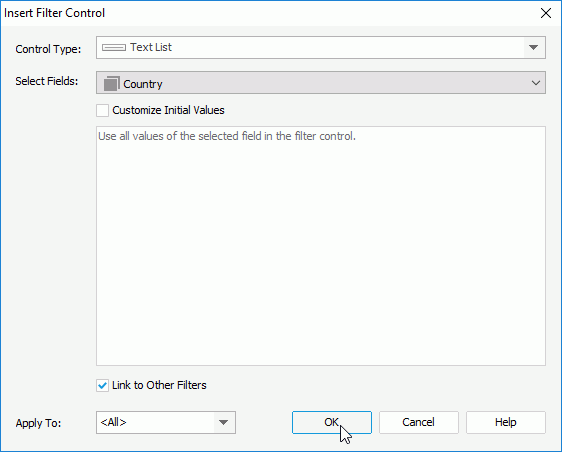
- Select the left cell in the second tabular cell row to Insert another filter control in the cell, based on the field Product Name using the same way.
Next we will add a navigation control which helps end users deal with the filter applying status in both filter controls in the report: go back to the previous filter applying status, go forward to the next, or clear all the filter applying histories. We will create the navigation control above the chart in the report.
- Right-click the blank area in the cell the chart is in and select Insert Row Above from the shortcut menu.
- Select the right cell in the newly added tabular row, select Insert > Web Controls > Navigation Control.
Lastly, we will insert an image to show the title of the report in the report page header panel.
- Select the blank cell above the navigation control, select Insert > Image.
- In the Select an Image dialog box, double-click ProductSalesHeader.gif to insert the image.
Now all the components needed in the report have been inserted in separate tabular cells.
Task 2: Improve the Report Layout
In this task we will make some changes to the position and size of the components to improve the report layout.
- Drag and drop the components in the tabular cells to make them top-left aligned in each cell, as shown below:
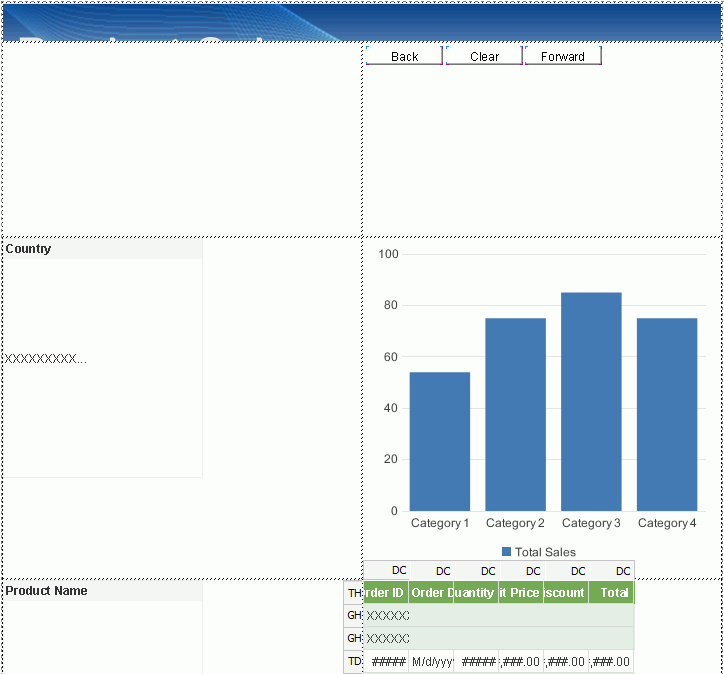
- Change the height of the cell that holds the image to make the image fully occupy it.
- Change the height of the tabular cell holding the navigation control to make it fit the height of the navigation control.
- Change the width of the tabular cell which contains the table to make sure all columns in the table can be shown.
- Resize the chart to make it fully occupy the cell it is in.
The cell above the Country filter control is empty, so next we will make the cell merged with the cell that holds the Country filter control.
- Select the empty cell and the cell the Country filter control is in by pressing the Ctrl key, right-click and select Merge from the shortcut menu.
- Resize the two filter controls to make them fully occupy the cells they are in.
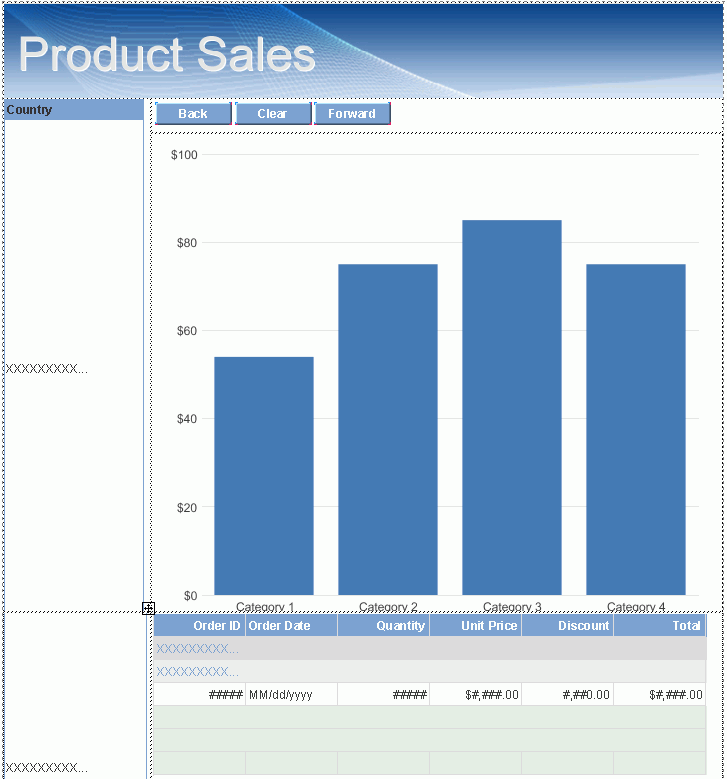
Designer displays the report as follows in design view now:
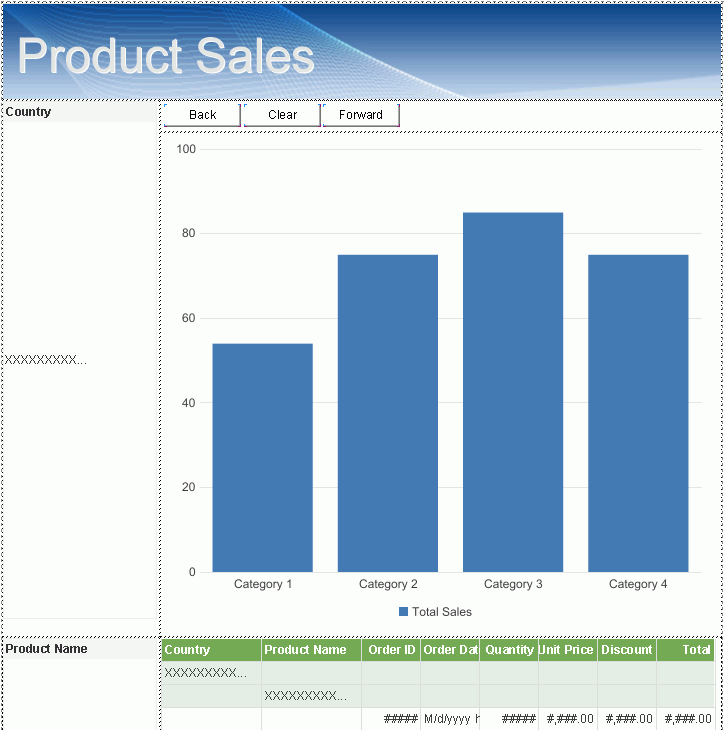
Task 3: Format the Report Components
To improve the report appearance, we need to further format the components in the report. First, we will format the chart.
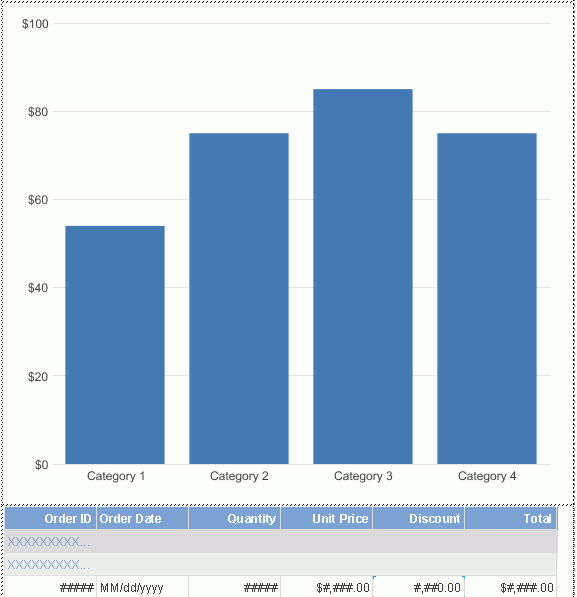
- Right-click on the chart and select Hide Legend from the shortcut menu.
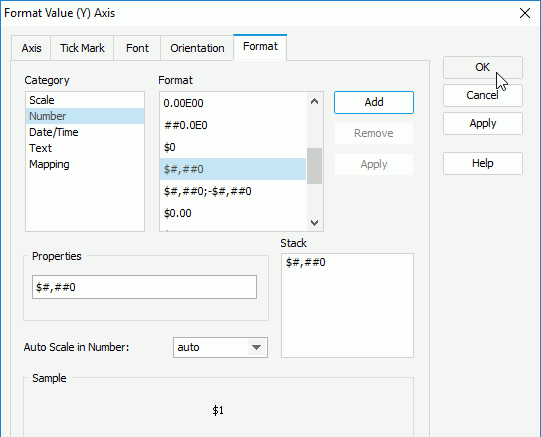
- Right-click on any bar, select Format Axes > Format Value (Y) Axis on the shortcut menu.
- In the Format Value (Y) Axis dialog box, go to the Format tab, select Number from the Category box, select $#,##0 from the Format box, then select Add to add the format in the Stack box. Select OK to exit the dialog box.
Next, we will format the table by editing its object properties in the Report Inspector:
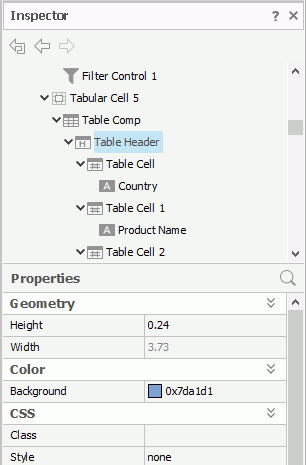
- In the report structure tree of the Report Inspector, select the Table Header node and set its Background property to 0x7da1d1.
- Select the Table Group Header node and set its Background property to 0xd9d9d9, then select Table Group Header 1 and set its Background property to 0xeeeeee.
- In the table select the two group-by fields in the group headers (GH) by holding the Ctrl key, resize them horizontally to make sure the country and product names won't get truncated, then in the Report Inspector, set the Foreground property to 0x7da1d1.
- Select the Order Date DBField in the detail row (TD), edit its Format property to MM/dd/yyyy.
- Press the Ctrl key and select the Unit Price and Total DBFields in the detail row, then edit the Format property to $#,###.00.
- Select the Discount DBField in the detail row and modify its Format property to #,##0.00.
The chart and table now look as follows:
Next, we will format the two filter controls and the navigation control:
- Select the two filter controls in the report, then in the Report Inspector, set the Border Color property in the Border category to 0x7ca2cf, and Background property in the Title category to 0x7ca2cf.
- Select the three buttons in the navigation control, then in the Report Inspector modify the Bold property to true, Background to 0x7ca2cf, and Foreground to White.
After doing the formatting, Designer displays the report like below:
- Select File > Save to save the report as Products.wls.
Task 4: Preview the Report in Web Report Studio
In this task we will use the Preview as Web Report Result command of Designer to preview the report and test the filter controls in the report, however this command is enabled only if the option Server for Previewing Reports was specified when installing Designer.
- Select View > Preview As > Web Report Result on the menu bar. The report is opened in Web Report Studio in the default web browser.
You will find that the report layout is not so perfect as Web Report Studio adopts responsive view by default to suit different mobile devices. To close responsive view, select the Customize Buttons button
 on the toolbar and select Close Responsive Mode from the menu list. The Close Responsive Mode button
  is then displayed on the toolbar. Select the button to close responsive view.
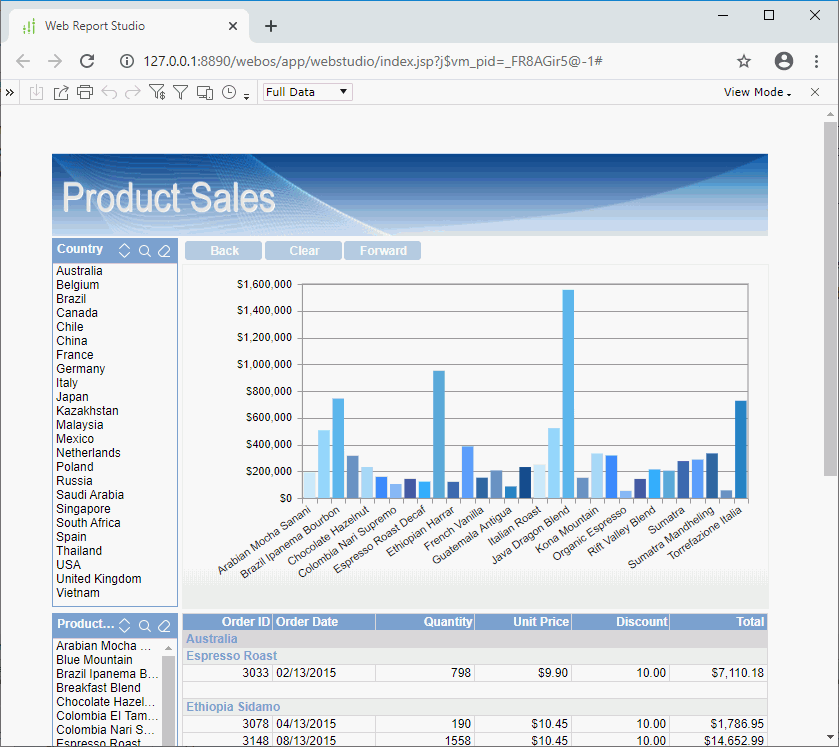
We can use the filter controls to dynamically change data displayed in the report. Since the chart and table are based on the same business view and the filter controls use fields from this business view, the filters created via the filter controls will be applied to them both at the same time. First, we want to view the sales in Canada.
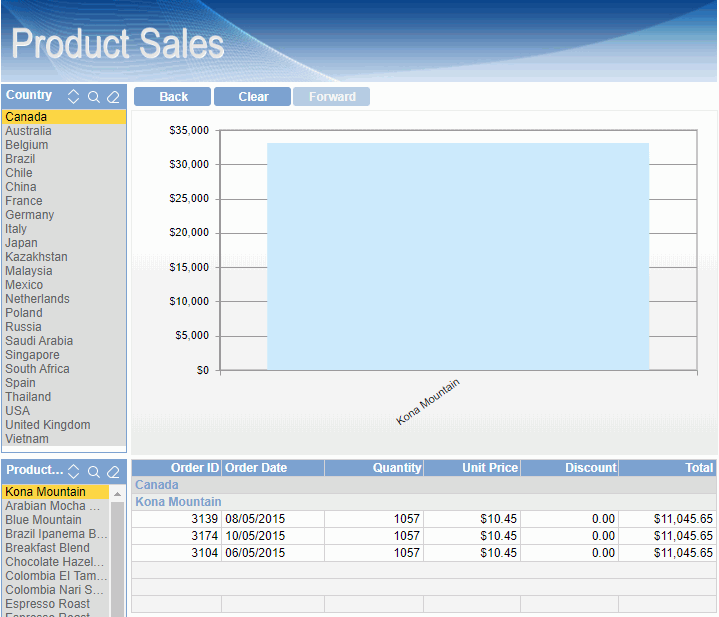
- Select Canada in the Country filter control, then the chart and table is refreshed to display the data for Canada only.
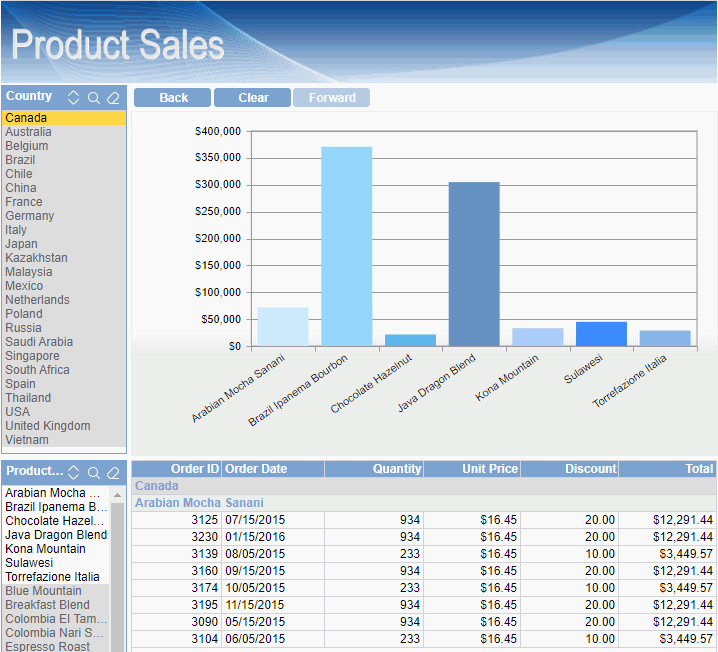
- To further view the product Kona Mountain's sales in Canada, select Kona Mountain in the Product Name filter control. The report is refreshed to show the corresponding data:
- Now we would like to see the sales of Blue Mountain, Breakfest Blend and French Roast in all countries. Since the current report data is for Kona Mountain's sales in Canada, we need to remove the filters firstly. Select
 on the title bar of each filter control to clear the value selection in them. We can also make use of the navigation control in the report to achieve the same goal: in the navigation control above the chart, select Back twice to undo what we have just done in the above two steps, or select Clear to simply clear the filter conditions in all filter controls.
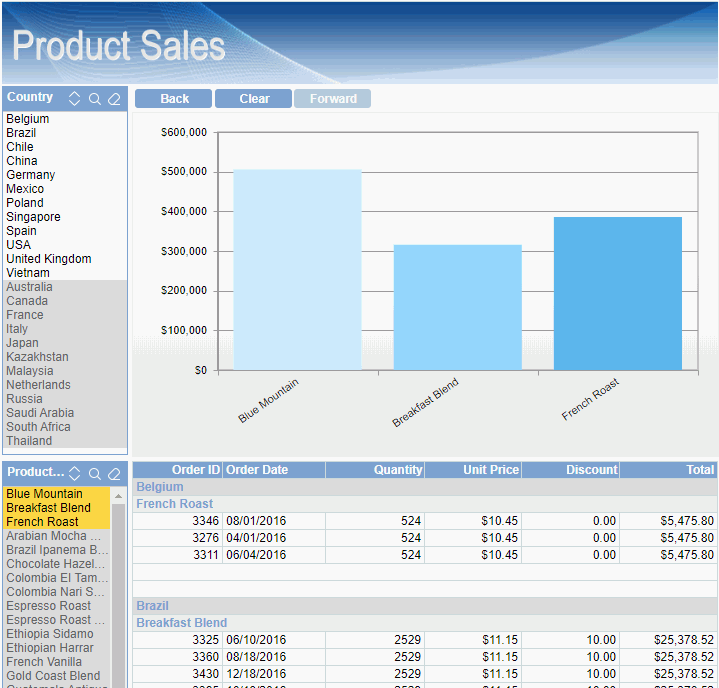
 - Press the Ctrl key on the keyboard, select Blue Mountain, Breakfest Blend, and French Roast in the Product Name filter control, then release the Ctrl key. The report now shows as follows:
- Exit Web Report Studio.
You can go to Creating a Web Report the Quick Start Way and Creating a Web Report Using the Wizard to get more information about working with Web Report Studio.
 Previous Topic