Report Development Environment
The Logi Report Designer development environment, shown below, consists of the following parts:
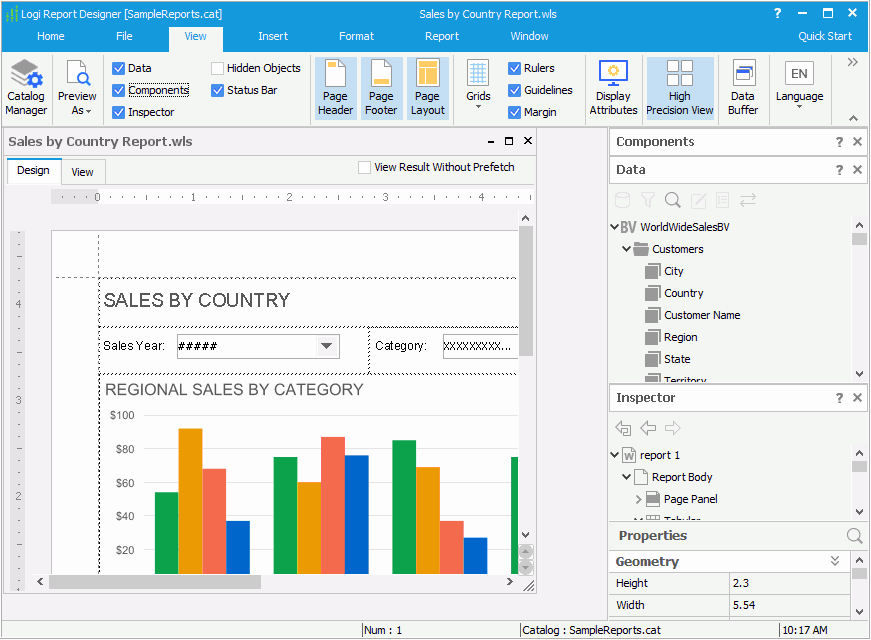
Menu Tabs

The following components are available in the Menu tabs:
| Tab | Description |
|---|---|
| Home | Contains the basic options for working in Logi Report Designer, such as the commands for creating, opening and saving a report, undoing or redoing an operation, editing the font properties like font face, size, color, alignment, and so on. |
| File | Contains options for working with report files such as saving and closing report files, publishing the report files to Logi Report Server. |
| View | Contains options for showing or hiding specific elements in the Logi Report Designer window. |
| Insert | Contains options for inserting different report components into a report, such as Table, Chart, Crosstab, Map, KPI, Web Control, Image, Label, and so on. You can also insert the components into a report by dragging them from the Components panel. |
| Format | Contains options for setting object position and editing font properties. |
| Report | Contains options for working with the current report, for example you can manage the datasets used in the report, adjust the display sequence of parameters used in the report, and so on. |
| Window | Contains options for laying out the open reports and switching between the reports. |
Design/View Area
The Design/View area is the window where you develop and test your reports, as shown below:
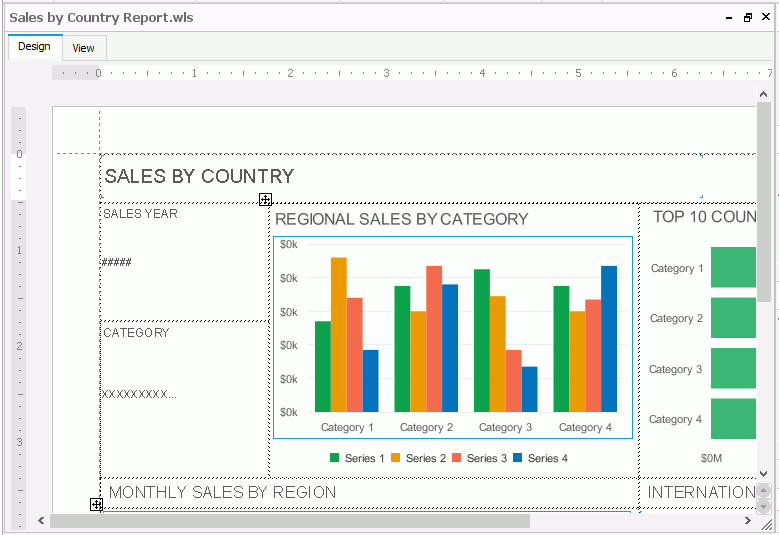
The Designer/View Area comprises of the following sections:
- Title bar
The title bar shows the report file name, and three buttons for you to minimize, maximize and close the active report. - Design tab
The Design tab is for laying out your report. You can make use of rulers, grids and guidelines to position objects. - View tab
The View tab is for previewing the report layout and result. The report may not display exactly as the user would see it in Logi Report Server. Interactive objects such as parameter and filter objects are not active and report links are not active. - Report tab bar
The report tab bar is for switching among report tabs in a page report. It also provides a shortcut menu that allows you to rename, duplicate, or remove a report tab.
Data Panel
The Data panel, shown below, is an integrated interface for managing the data resources that can be used in the current report. It contains a toolbar and a resource tree. The toolbar provides options for managing the data resources; the resource tree lists all available resources in the current catalog that are valid for the current report.
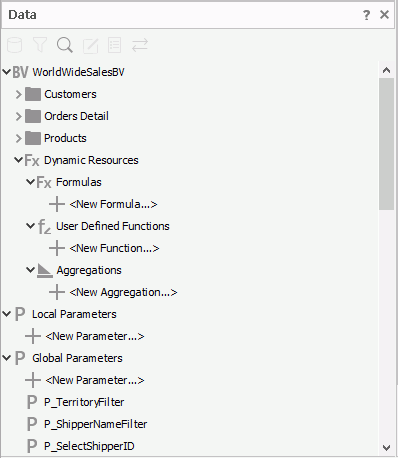
You can drag resources from the panel into the report. Queries, business views, formulas, summaries, and parameters in this panel respond to right-clicking events, and thus provide you with shortcuts for editing them in the same way as you would do in the catalog with the Catalog Manager.
Components Panel
The Components panel, shown below, lists all the components that can be inserted into a report.
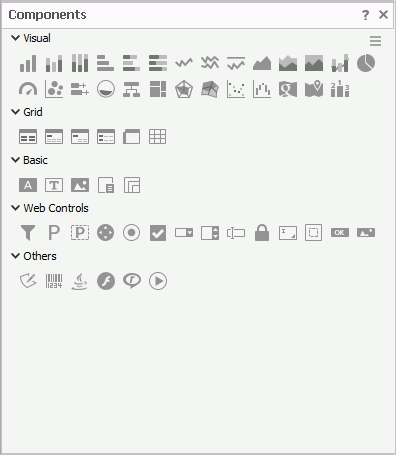
The components are classified as follows and they vary according to different report types.
- Visual: Chart, Map, KPI, Rank
- Grid: Table, Crosstab, Tabular
- Basic: Label, Text Box, Image, Subreport, Banded Object
- Web Controls
- Others: UDO, Barcode, Multimedia Object
The method to create a component using the Components panel is to drag a button representing that component from the panel to the desired location in the report design area.
Inspector Panel
The Inspector panel (also referred to as the Report Inspector) lists all the objects contained in a report in a tree structure. You can edit the object properties in the panel to change the appearance of your report.
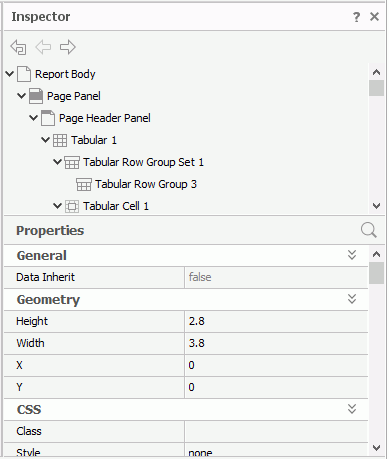
The Inspector panel contains a toolbar, a report structure tree and a Properties sheet.
Toolbar
The toolbar is useful for page reports. It provides buttons for switching between the three levels of a page report: report, report tab, and report body.
Report structure tree
All the objects in the current report are listed in a tree structure. By selecting an object in the tree you also select it in the report design area. You can use the Ctrl and Shift keys to select multiple objects, then the Properties sheet will show only the properties that are common among the selected objects and you can change the property values for all the selected objects at a time.
Properties sheet
This sheet lists all the properties of the object selected in the report structure tree. You can change how an object appears and behaves by changing its property values in this sheet. Depending on the object type, the properties that a certain object holds may greatly differ from those of another.
 Previous Topic