Embedded Reports and DataLayer links
Hello all,
So am I missing something with how an embedded Logi report handles linked datalayers under charts etc?
I created a dashboard based on an API response, this one dataset can populate 6+ charts with only a small amount of aggregating done by Logi. I initially returned the data in a @Local datalayer and created a data layer link. I created the various charts using the DataLayer.Link as their sources. All looks good when run directly in the Logi app.
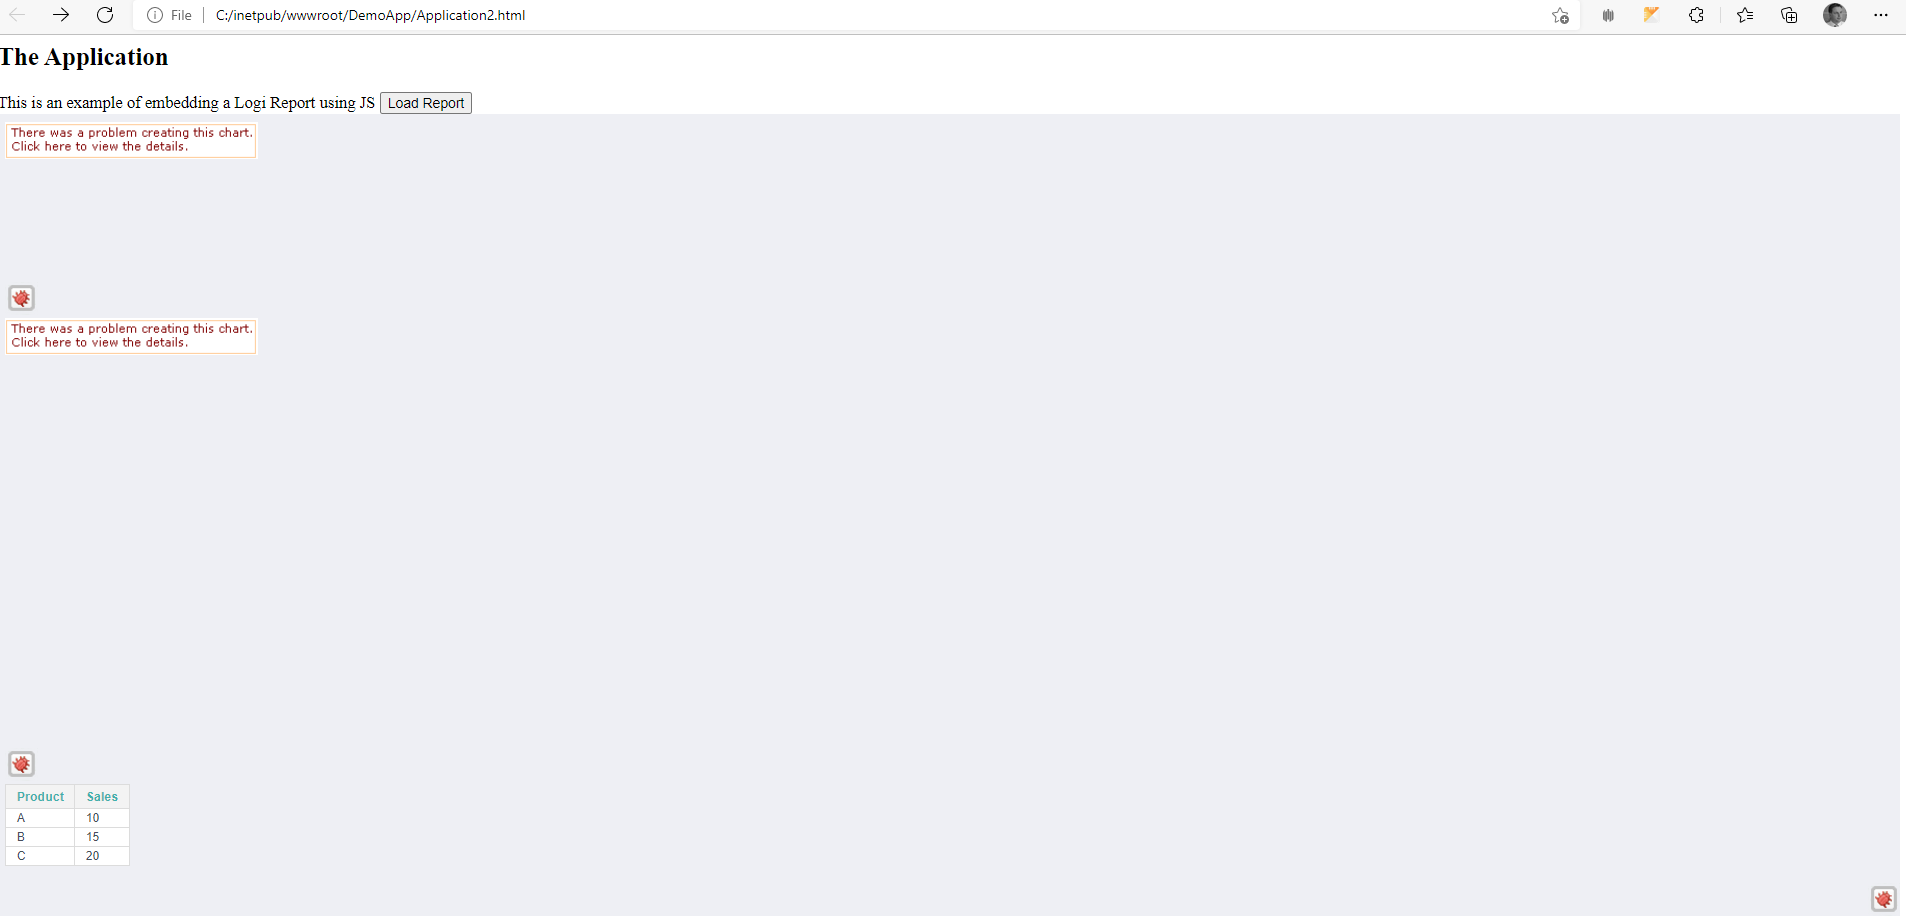
However when I embedded the report in a simple HTML page of my own design using the JS methods, I get errors under the charts stating it can't find the linked datalayer. If I use the linked data layer as a source for a standard data table that works ok.
I don't really want to have to hit the same API 6+ times to generate the dashboard.
I'm hoping i've just missed something. Eventually these dashboards will be embedded into our application properly - I want to make sure they will work well before we get to that point.
I've included a sample standalone .lgx and HTML that illustrates my issue in the following posts.
-
<?xml version="1.0" encoding="utf-8"?>
<Report
ID="ExampleEmbedReport"
>
<LocalData>
<DataLayer
ID="StaticDataLayer1"
Type="Static"
>
<StaticDataRow
Product="A"
Sales="10"
/>
<StaticDataRow
Product="B"
Sales="15"
/>
<StaticDataRow
Product="C"
Sales="20"
/>
<DataLayerLink
ID="dlSalesData"
/>
</DataLayer>
</LocalData>
<Body>
<Gauge
Caption="TotalSales"
Type="Number"
Value="@Data.sumOfSales~"
>
<DataLayer
ID="dlTotalSales"
LinkedDataLayerID="dlSalesData"
Type="Linked"
>
<AggregateColumn
AggregateColumn="Sales"
AggregateFunction="Sum"
DataType="Number"
ID="sumOfSales"
/>
</DataLayer>
</Gauge>
<ChartCanvas
ID="ChartCanvas1"
>
<DataLayer
ID="salesData"
LinkedDataLayerID="dlSalesData"
Type="Linked"
/>
<Series
ChartLabelColumn="Product"
ChartYDataColumn="Sales"
Type="Pie"
/>
</ChartCanvas>
<DataTable
ID="dtTable"
>
<DataLayer
ID="dlTableSales"
LinkedDataLayerID="dlSalesData"
Type="Linked"
/>
<AutoColumns/>
</DataTable>
</Body>
<ideTestParams/>
</Report>
0 -
<html>
<head> </head>
<body>
<h2>The Application</h2>
This is an example of embedding a Logi Report using JS
<button onclick="CreateReport()">Load Report</button>
<div id="reportContainer"/>

<script type="text/Javascript">
function CreateReport() {
var options = {
applicationUrl : "http://localhost/DemoApp/",
report : "ExampleEmbedReport",
autoSizing : "all",
linkParams : { "ClientCodePath": "ba5ccdf2-f702-49c5-b3f0-9883a0a7bbc2"}
};
var report = EmbeddedReporting.create('reportContainer', options);
}
</script>
<script src="http://localhost/DemoApp/rdTemplate/rdEmbedApi/rdEmbed.js" type="text/Javascript"></script>
</body>
</html>
0 -
Hi Martin,
Your example seems to be working okay for me? I would maybe look out for a CORS issue when using the API though. Just check the Network tab of the browser developer tools, when you try it you may need to reload the page to see the network traffic displayed fully. I think you should see your API request in there, so maybe check if it has errored and is highlighted in red
0 -
Hi Glyn,
Thank you for your response. The issue I have isn't related to the API unfortunately. The example I gave above (using a DataLayer.Static) does not work for me, you can see the errors for Gauge.Number and Chart.Canvas plus the successful DataTable at the end. All are using the same DataLayer.Linked built from the DataLayer.Static. I have had the same result when I have tried to use a .JSON text file as a datasource.

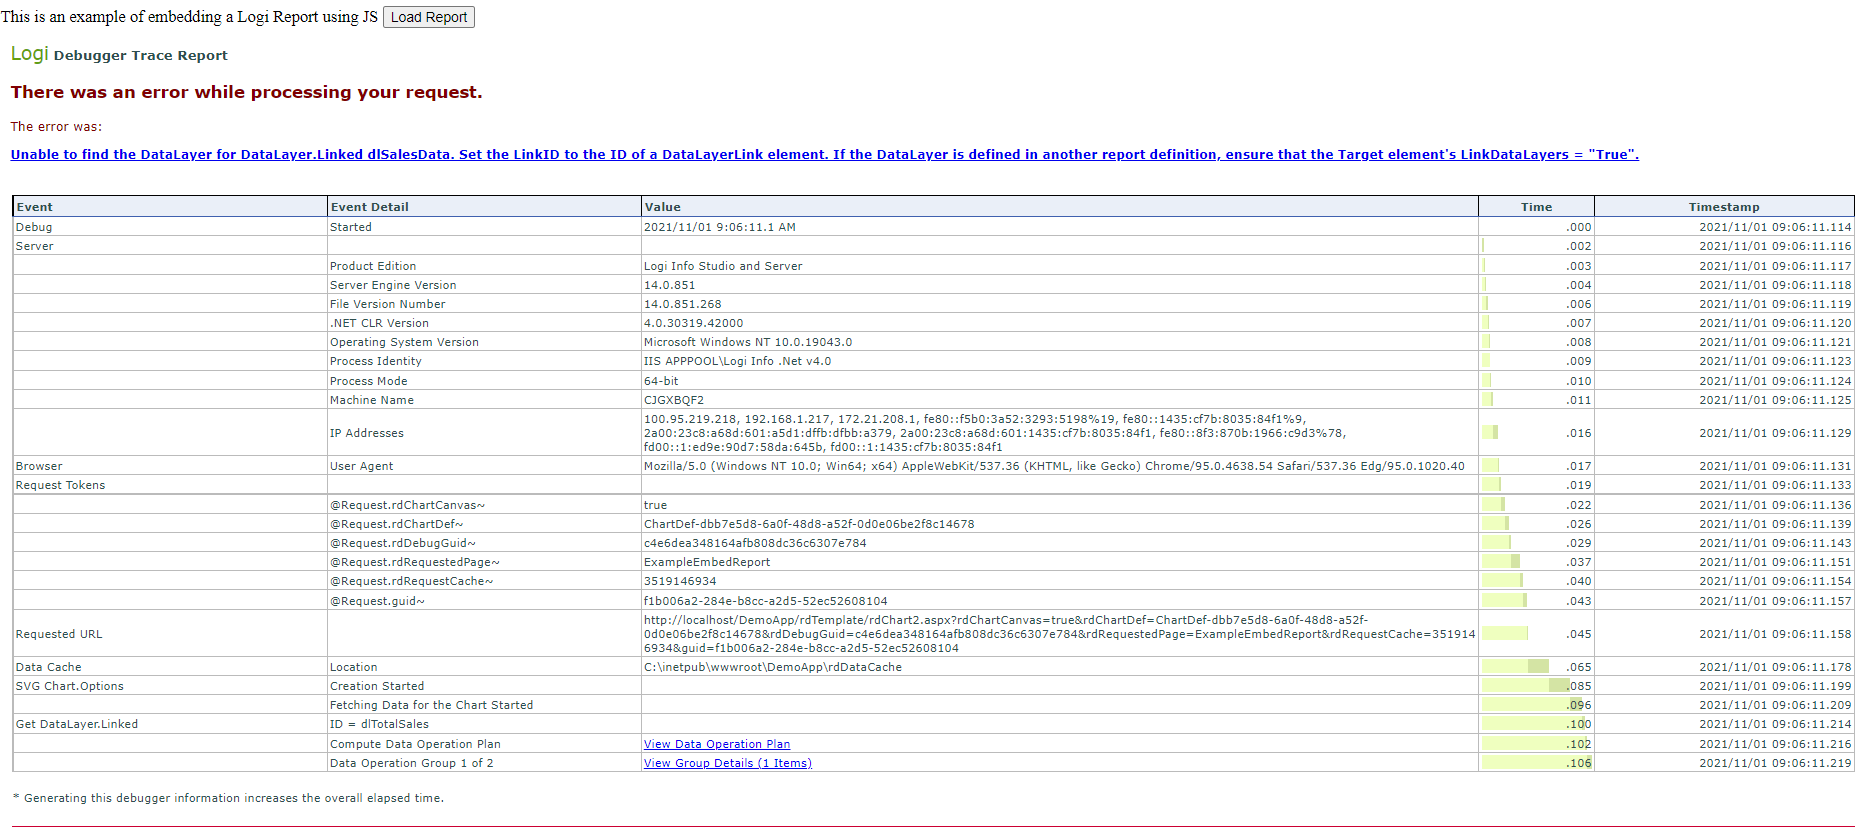
The debug from the Gauge.Number element:
I can see in rdDataCache the following files after I run the report from my HTML page:

When I run it from my Logi App, which runs successfully - get an extra file that seems to be the data source for the Chart Canvas: 0
0 -
Hi Martin,
There has been a few things I've seen in this area before, one was related to an issue with IIS on Windows Server 2012 R2 quite a few years back now, where it caused an app pool restart and the directory to be cleaned up when it saw high file i/o activity. I can see you're on Windows 10 as well as the fact you have other files in the directory so it's probably safe to say it's not that. The other reasons were related to session state being lost and sometimes permissions.
As you're running this in a local environment, are you able to try opening up permissions on the rdDataCache directory?
If you have no joy here, there is an alternate approach you could potentially use and that's to setup your data layers using a datalayer cache instead of the datalayer.linked. You would just need to refer to the same cache key on each visual, and depending on the currency of the data, this would have the added advantage of being available to all users and all reports that access the same cache key, so you could reduce database load even further. It does depend on how you can setup the cache timeout though, and may connections to constantly updating transactional databases may restrict your options.
The last option will be to log a support ticket and someone from the support team maybe able to spend a bit more time helping to investigate the issue, or they may have an answer ready for you
0 -
Hi Glyn,
Thank you for this. I tried opening up the rdDataCache directory to everyone, still no luck. I'm not sure Cached data is the way to go for us - it would have to expire pretty much straight away due to the nature of the data.
I will open a support call.
Thanks
Martin0 -
No problem, Martin sorry I wasn't able to help. Hopefully the Support team have the answers for
Best regards
Glyn0
Please sign in to leave a comment.
Comments
7 comments