Is there any way to style the legends of the chart
Hi
Currently on the line chart legends look like this 
but what we want to style the legends like this
Is there any way to style the legends in logi using any element in the canvas chart?
-
Hi Anvita,
There are some things you can do with the Marker Points elements under the chart series. I don't think that will let you do exactly what you need to though. You can do this using the charts API. The Charts API let's you break into the chart visualisation code so that you can update the plot options as required. It takes a little bit to work it out, but it gives you the most flexibility
Logi Info Charts use the Highcharts Library, here is a Highcharts example that shows you what to target in the Plot Options to set your markers: https://jsfiddle.net/gh/get/library/pure/highcharts/highcharts/tree/master/samples/highcharts/plotoptions/series-marker-symbol/
Here is a link to the Logi Charts API, it is likely you would need to use the beforeCreatChart event: https://devnet.logianalytics.com/hc/en-us/articles/4402865599895-Logi-JavaScript-API-for-Chart-Canvas-Charts
I hope this helps, if you need more help with this then I can recommend using some of your EOD hours. You can find out more about EOD from your CAM if you'd like to follow up on this
Best regards
Glyn
0 -
The legends marker points on the line are also modified in the Highchart sample you shared in this, but I simply want to update the legends.
0 -
Hi Anvita,
In this case you would add your series as normal, but then using the beforeCreateChart event you can intercept the chart creation and then you should be able to manipulate the series, by copying and removing the data from the main series, setting the marker and creating a second series beneath adding the copied data and then linking to ("linkedTo") the main series above
Here is a link to an example I found, however instead of using JQuery to create the Highcharts object from scratch you will use the Logi JavaScrcript Charts API with the beforeCreateChart event: http://jsfiddle.net/hnc27nf2/
Best regards
Glyn
0 -
Hi Anvita,
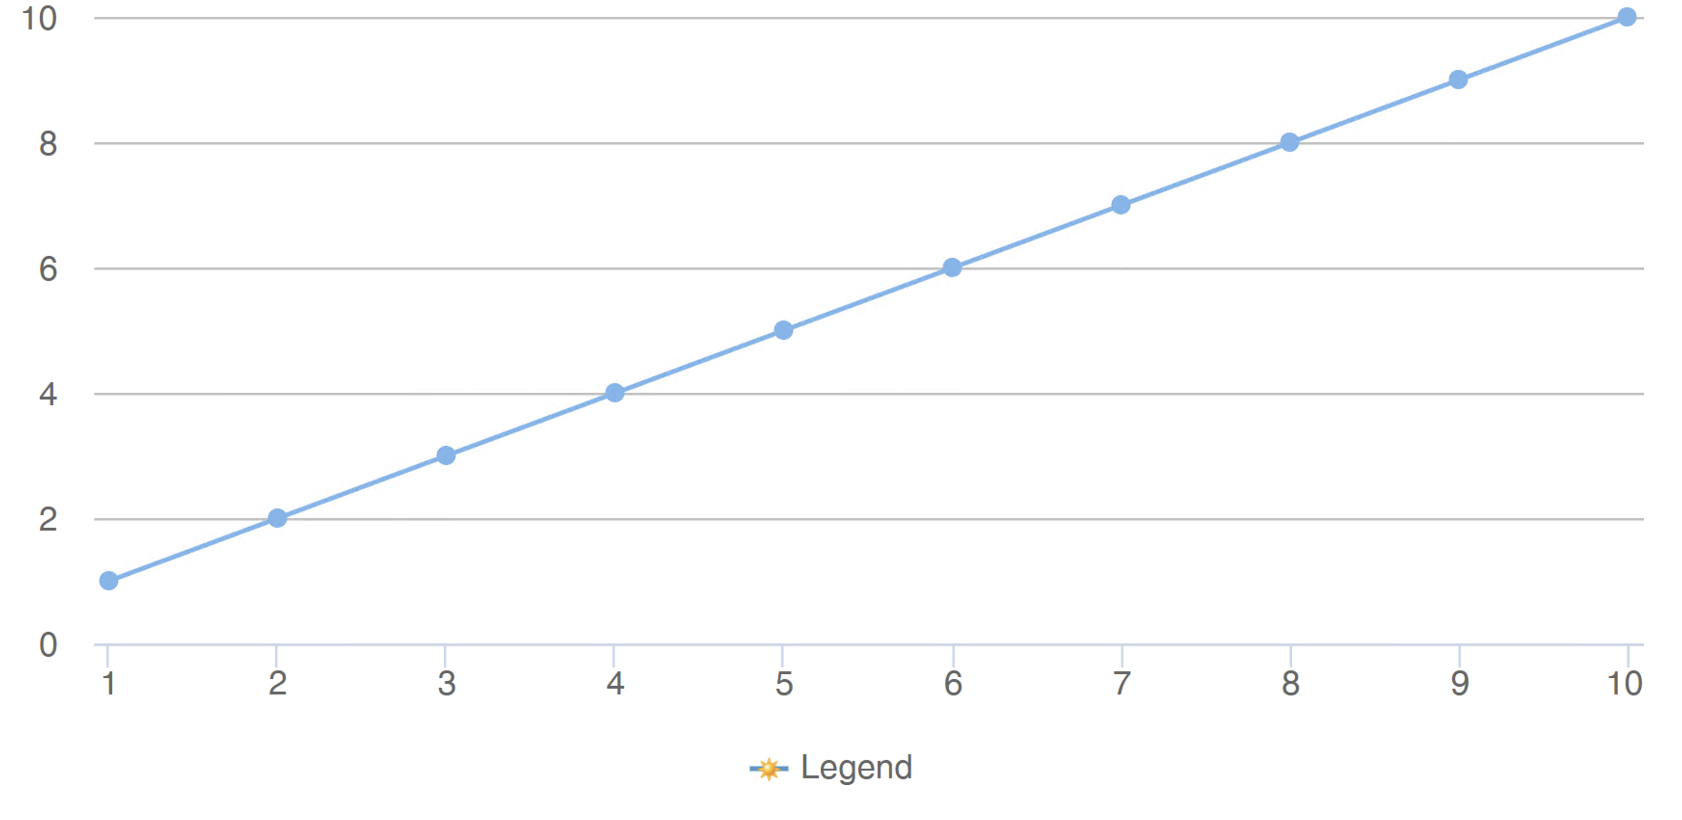
Here's a basic Logi version of the jsfiddle example above. You should be able to extrapolate from here for your own needs.
Kind regards
Glyn
<Report ID="ChartAPI-LegendIcon" SavedBy="LOGIXML\gmcKenna" SavedAt="2021-10-25 16:38:18" EngineVersion="14.0.883-SP1">
<ChartCanvas ID="myLineChart">
<DataLayer Type="Static" ID="StaticDataLayer1" IdeDisplayStatus="Collapsed">
<StaticDataRow x="1" y="1" />
<StaticDataRow x="2" y="2" />
<StaticDataRow x="3" y="3" />
<StaticDataRow x="4" y="4" />
<StaticDataRow x="5" y="5" />
<StaticDataRow x="6" y="6" />
<StaticDataRow x="7" y="7" />
<StaticDataRow x="8" y="8" />
<StaticDataRow x="9" y="9" />
<StaticDataRow x="10" y="10" />
</DataLayer>
<Series Type="Line" ChartYDataColumn="y" ChartXDataColumn="x" ID="main" LegendLabel="Legend" ConnectNulls="True">
<MarkerPoints MarkerPointSymbol="https://www.highcharts.com/samples/graphics/sun.png" />
</Series>
<ChartCanvasLegend AlignmentHorizontal="Center" LegendOrientation="Horizontal" />
</ChartCanvas>
<LineBreak />
<IncludeScript IncludedScript="var verticalBarChartContainer = Y.one('#myLineChart');
verticalBarChartContainer.on('beforeCreateChart', function(e) {
setSeriesLegendIcon(e);
});


function setSeriesLegendIcon (e) {
 if (e.options.series == null) {
 return;
 }
 
 console.log(e.options.series);
 var xdata = e.options.series[0].data;
 e.options.series[0].data = [];
 e.options.series.push({ linkedTo: e.options.series[0].id, data: xdata });
 console.log(e.options.series);
}
" />
</Report>0 -
Hi Glyn McKenna
With this examples, legends are not created an only a chart with marker points is created we only want the legends. So there is no way to do this with logi ?0 -
Hi Anvita,
What version of Logi Info is your application running? I'm running version 14 SP1 This is what the the definition above produces. The charting library was upgraded in version 14, so I'm guessing you're on version 12.x. Is it possible for you to upgrade at all?
 0
0 -
Hi Anvita,
I had another look to see if you can make it work with 12.x, and the following seems to do the trick (for me)
<Report ID="ChartAPI-LegendIcon" SavedBy="LOGIXML\gmcKenna" SavedAt="2021-10-26 11:51:22" EngineVersion="12.8.724-SP2">
<ChartCanvas ID="myLineChart" IdeDisplayStatus="Collapsed">
<DataLayer Type="Static" ID="StaticDataLayer1" IdeDisplayStatus="Collapsed">
<StaticDataRow x="1" y="1" />
<StaticDataRow x="2" y="2" />
<StaticDataRow x="3" y="3" />
<StaticDataRow x="4" y="4" />
<StaticDataRow x="5" y="5" />
<StaticDataRow x="6" y="6" />
<StaticDataRow x="7" y="7" />
<StaticDataRow x="8" y="8" />
<StaticDataRow x="9" y="9" />
<StaticDataRow x="10" y="10" />
</DataLayer>
<Series Type="Line" ChartYDataColumn="y" ChartXDataColumn="x" ID="main" LegendLabel="Legend" ConnectNulls="True">
<MarkerPoints MarkerPointSymbol="https://www.highcharts.com/samples/graphics/sun.png" />
</Series>
</ChartCanvas>
<LineBreak />
<IncludeScript IncludedScript="var myLineChart = Y.one('#myLineChart');
myLineChart.on('beforeCreateChart', function(e) {
setSeriesLegendIcon(e);
});


function setSeriesLegendIcon (e) {
 if (e.options.series == null) {
 return;
 }
 
 var xdata = e.options.series[0].data;
 e.options.series[0].data = [{x: 1, y: 1, marker: { enabled: false } }];
 e.options.series.push({ linkedTo: e.options.series[0].id, data: xdata });
}
" />
</Report>0
Please sign in to leave a comment.
Comments
7 comments