This article applies to Composer V5.9 and Zoomdata V4.9.
Where can I find "Include Blanks"?
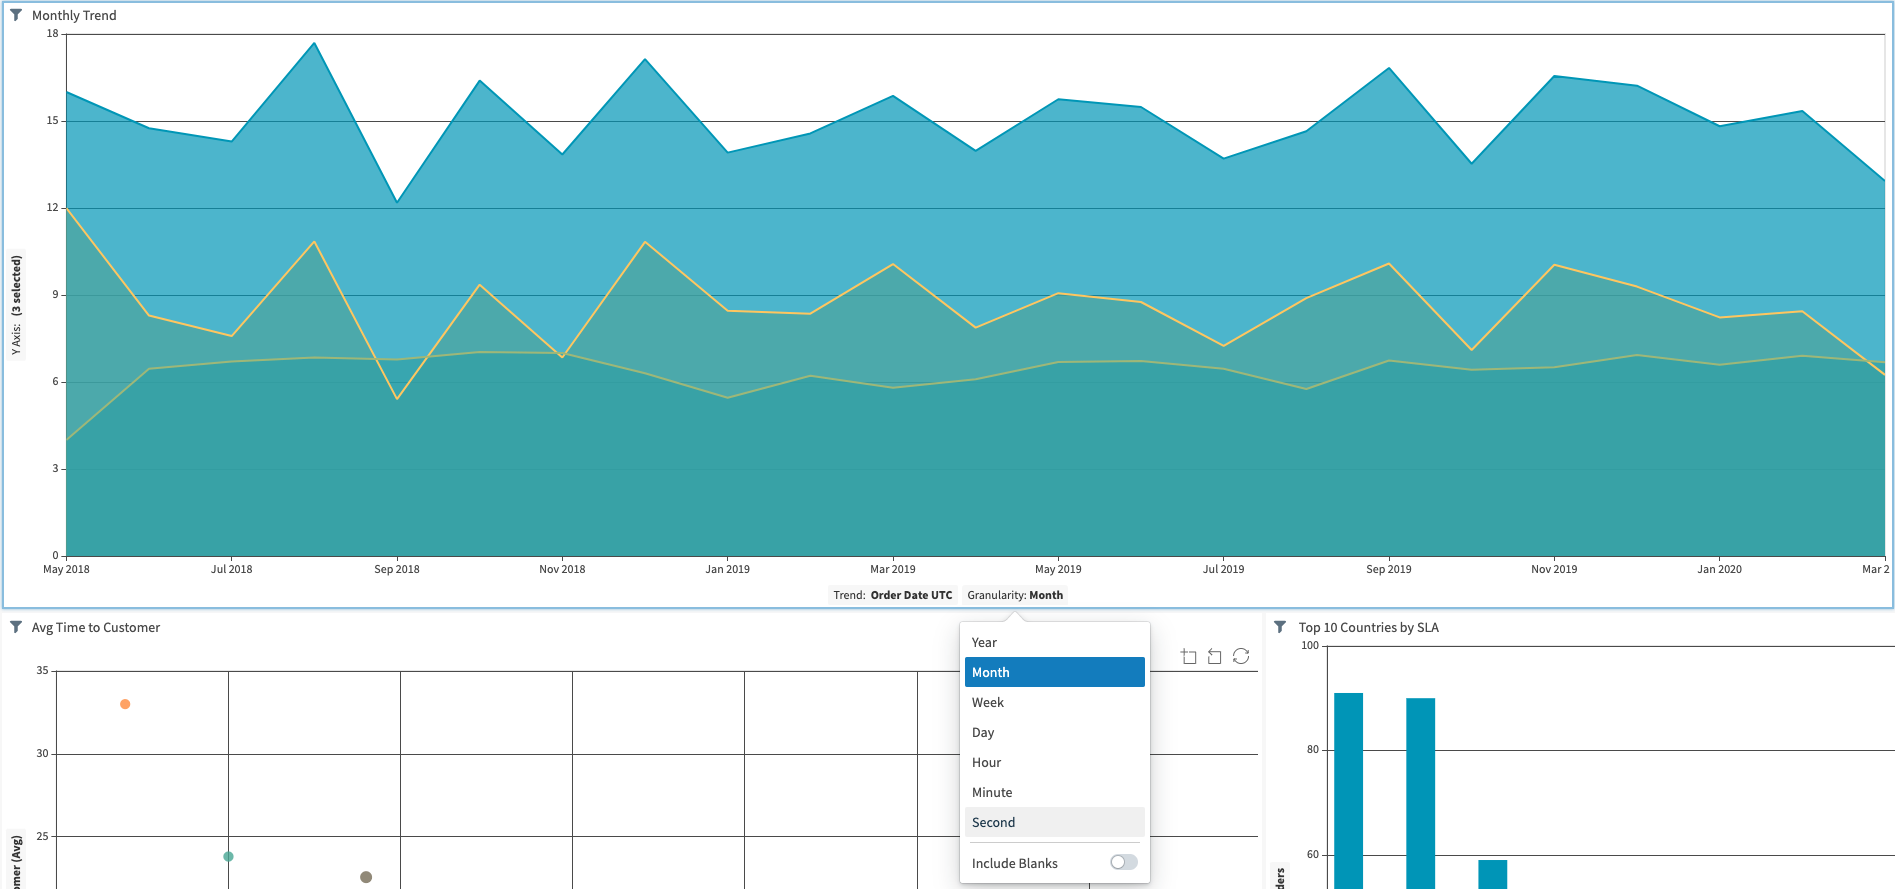
The Include Blanks checkbox can be found in the "granularity level" picker on trend charts, such as:

What happens if "Include Blanks" is NOT selected?
By default, "Include Blanks" is not selected when first creating a line trend chart.
In this case, only grouped-by time elements where data exists in the specified time range will return on the chart.
What happens if "Include Blanks" IS selected?
When "Include Blanks" is selected, Composer will apply the specified time range (as configured on the time bar) and show all the data points available within the range at the intended granularity (e.g. min, hour, etc.) on the chart. Where no data point is available within the range, the chart will display a blank space or gap.
Example
Assume that the time range is one hour and new data is being ingested every 5 minutes (which may not always contain new data values). Furthermore, granularity level of the trend chart is set at the minute level.
If "Include Blanks" is not selected....
Only the minutes that contain actual data for that hour will be shown on the trend chart.
If "Include Blanks" is selected...
Every individual minute from that hour should be shown on the chart (because granularity is set to minute level), whether they contain data or are left blank.