Logi JReport v15 Enhancements
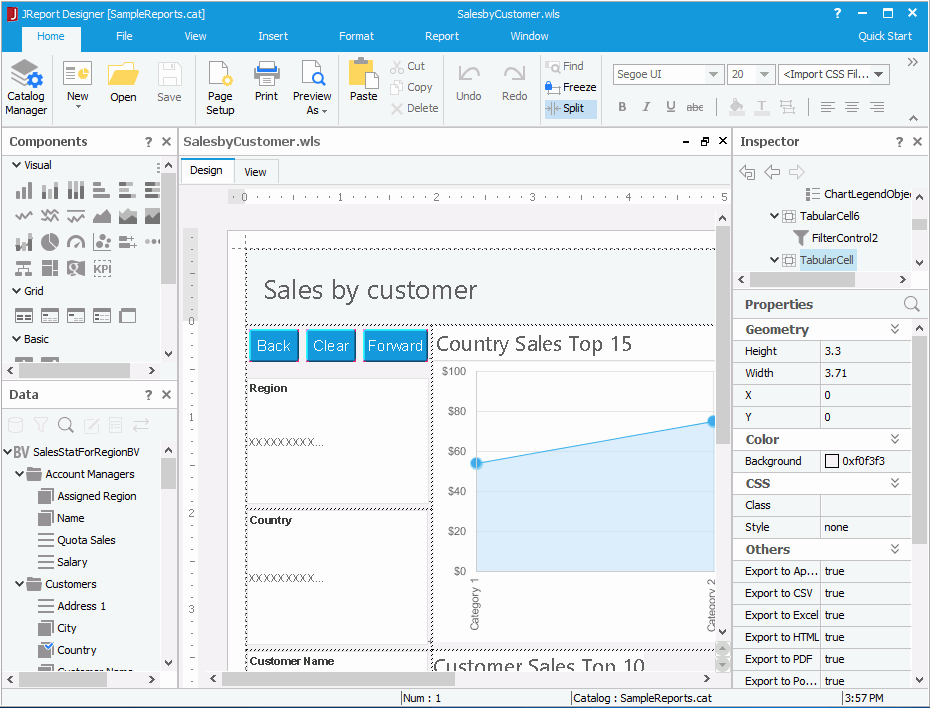
Logi JReport v15 is focused on improving the developer experience and productivity. With an all new user interface, Logi JReport Designer streamlines workflows in setting up database connections, creating visualizations and fine tuning reporting properties. Creation of KPIs and dashboards with animated, synchronized visualizations are also simplified with an intuitive drag and drop process.
New Logi JReport Designer
Logi JReport Designer features a new user interface that expands Quick Start, making it more intuitive for developers to connect to data sources, configure data models, and create reports and visualizations. Built-in templates are now extendable and customizable to work with any new data source. Contextual hints assist developer workflows in customizing visualizations with easily adjustable properties through a searchable inspector. The collection of new enhancements in Logi JReport Designer results in a much-improved user experience.

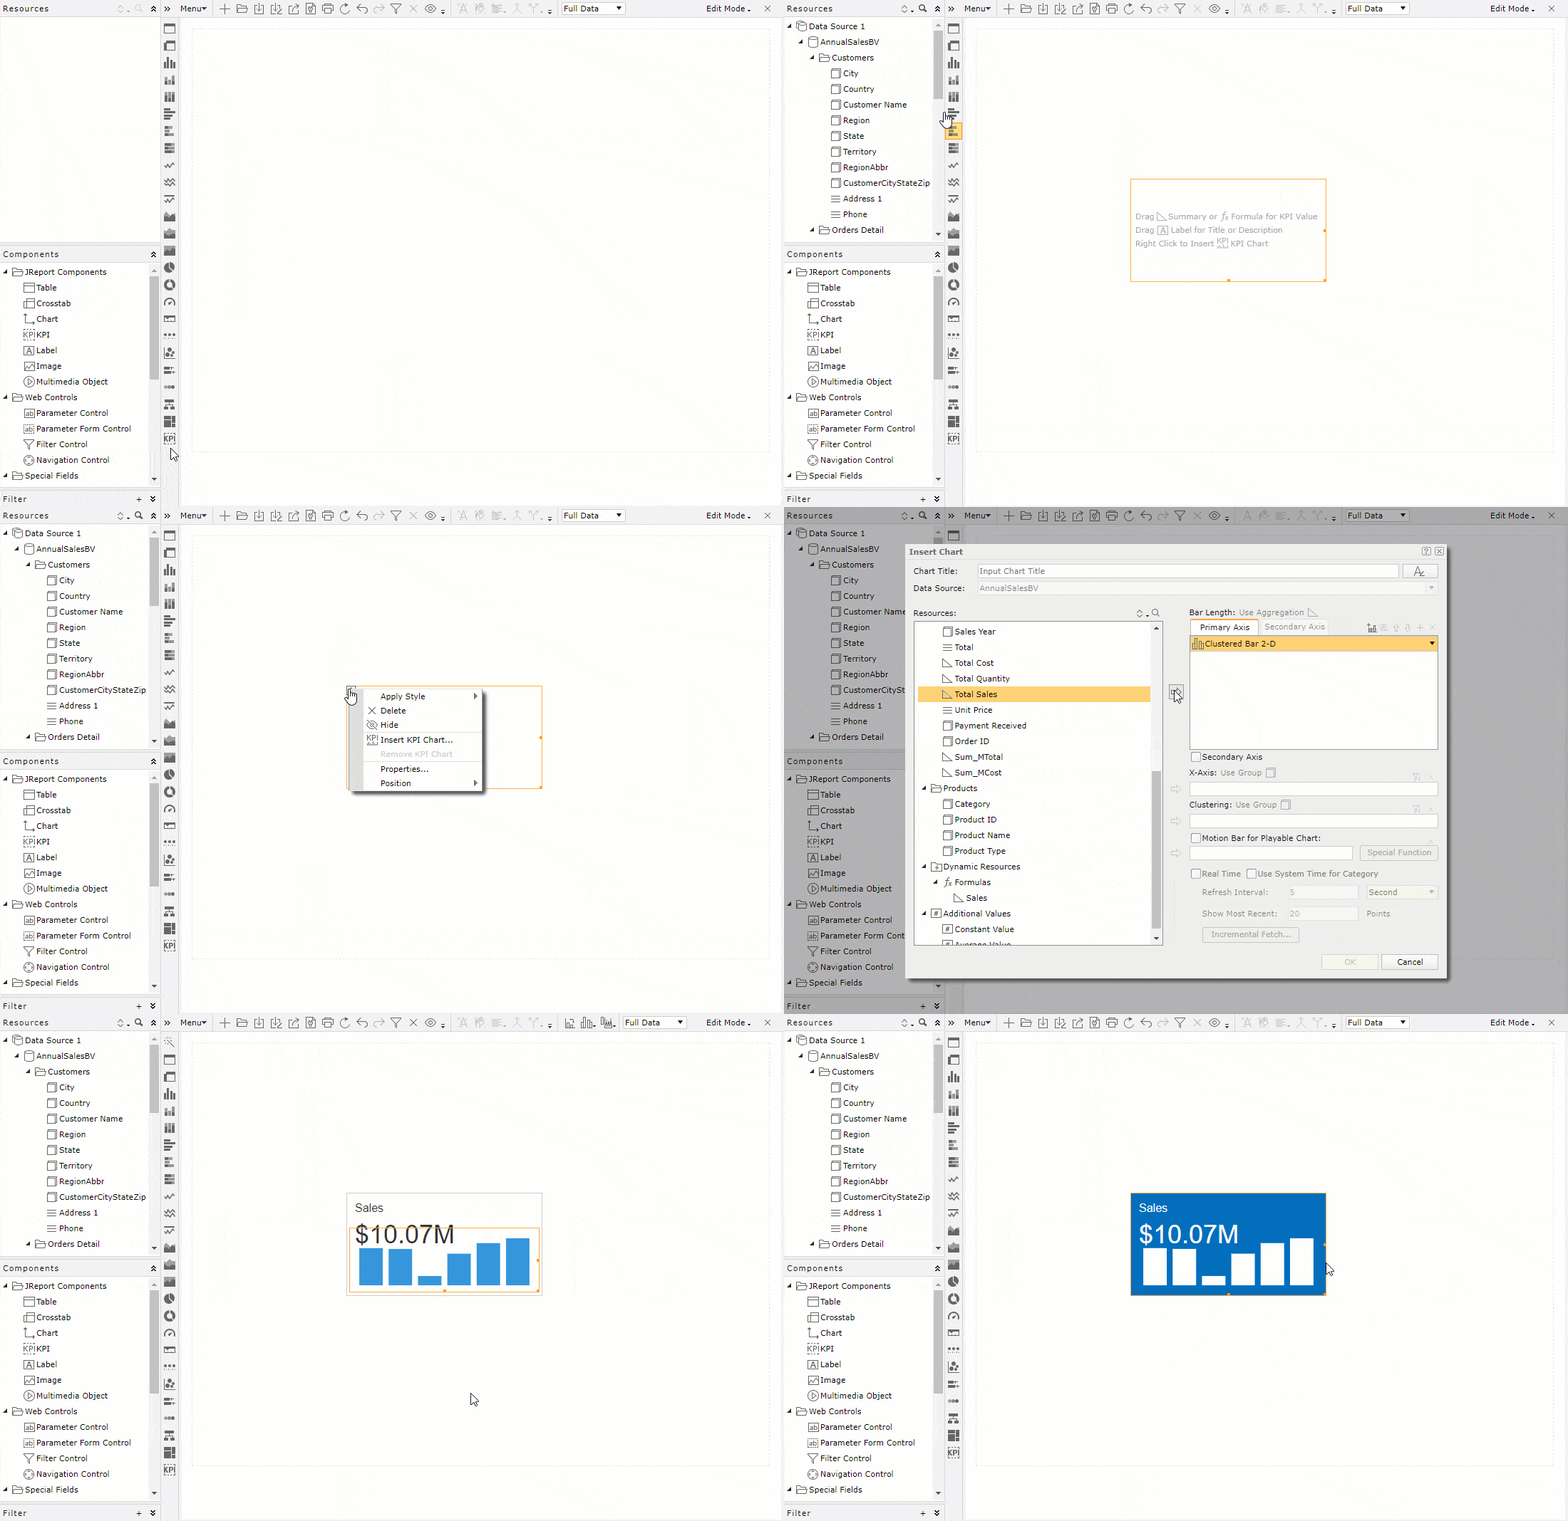
Quick KPI Maker
You can now create ad hoc KPI widgets by using templates and picking measures for automatic computations. KPI’s based on predefined functions can display any desired formats. Optional trend charts and one-click styling can be applied to further enhance the KPI visualization.

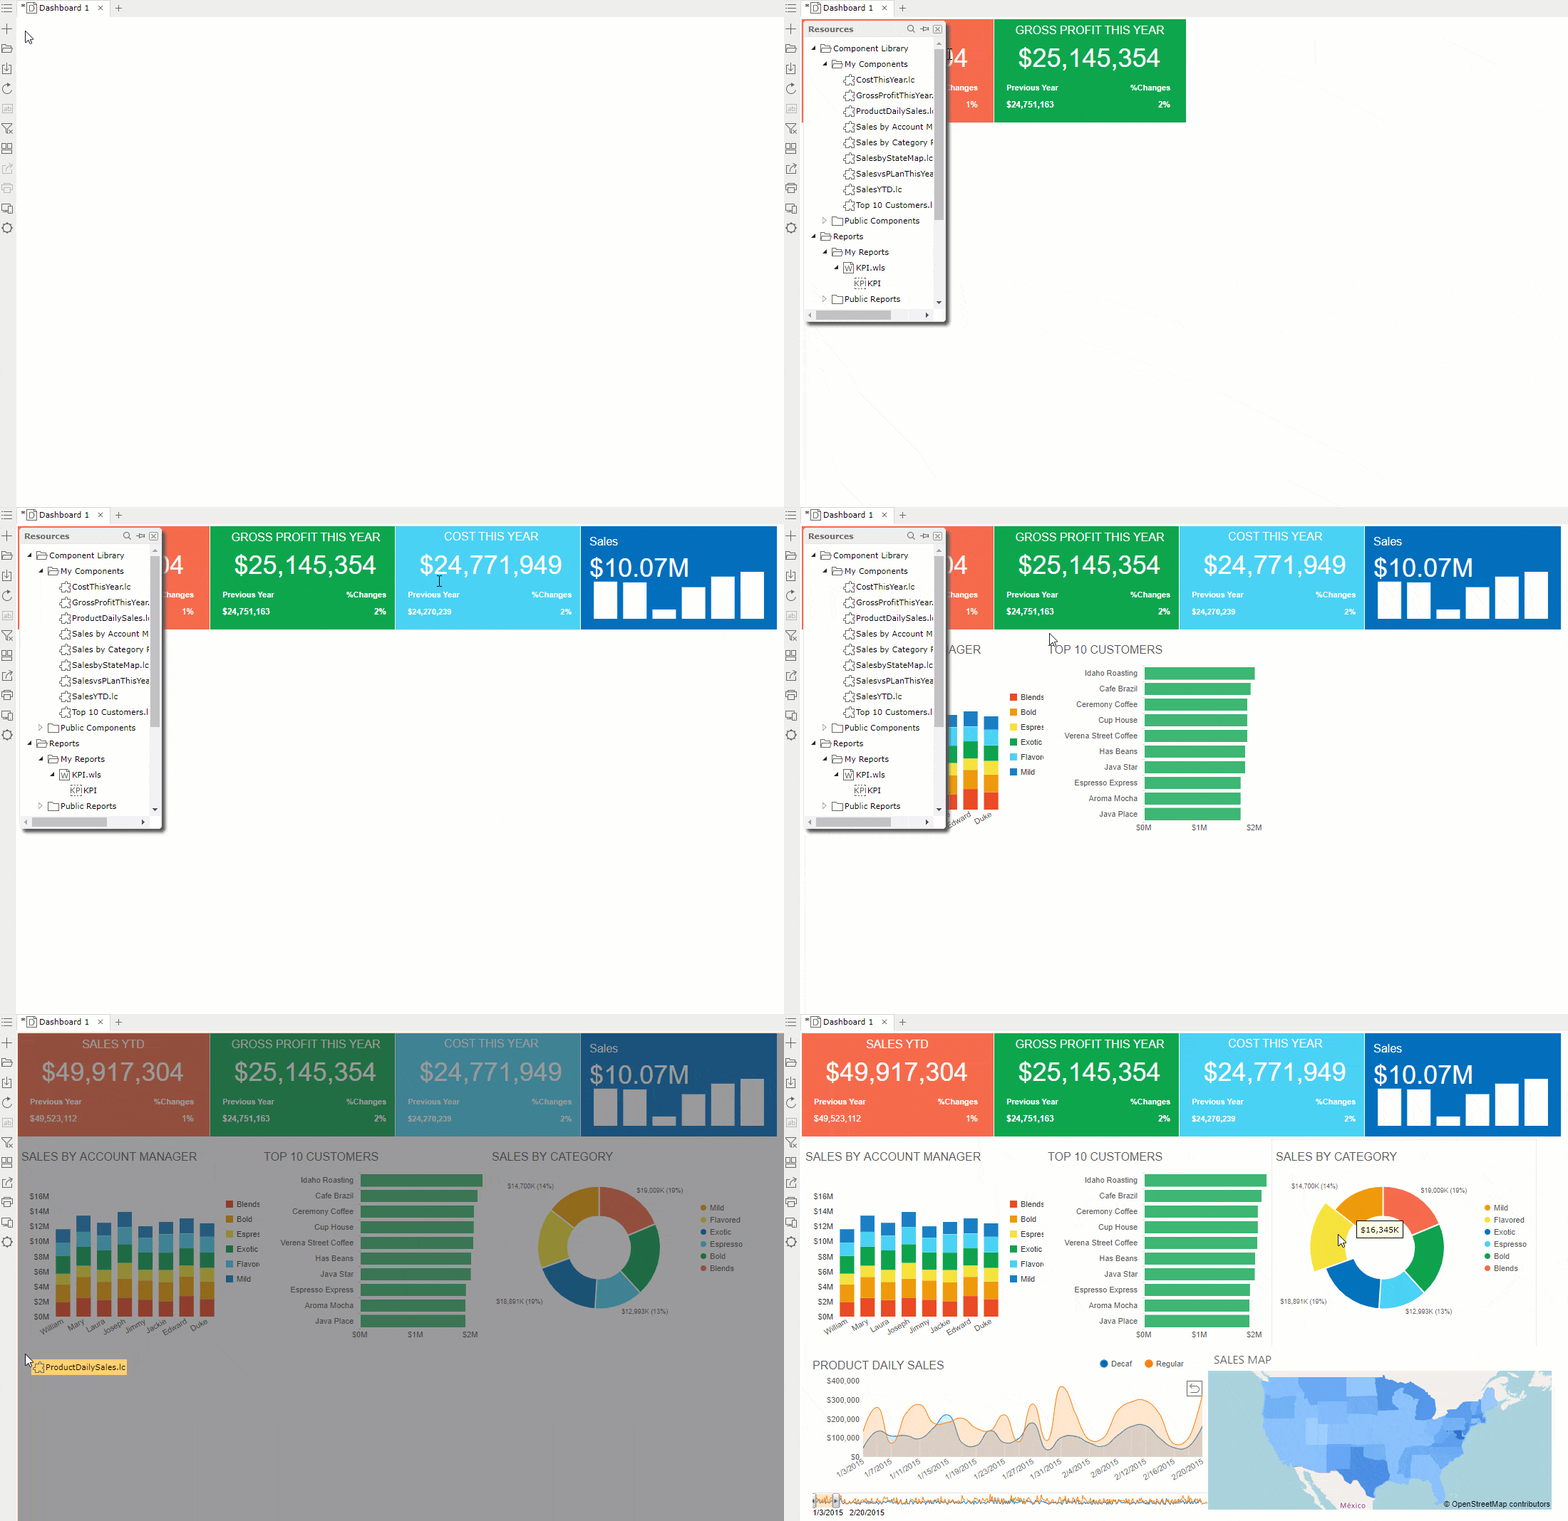
Dashboard with New KPI and Enhanced Visualizations
Creating highly expressive dashboards has never been easier. KPIs and new animated visualizations can be quickly dragged and dropped to form a dashboard. Add data synchronization rules and your drilling actions will always result in consistent and responsive views across the dashboard.

 Previous Topic