
Use the Radial Menu
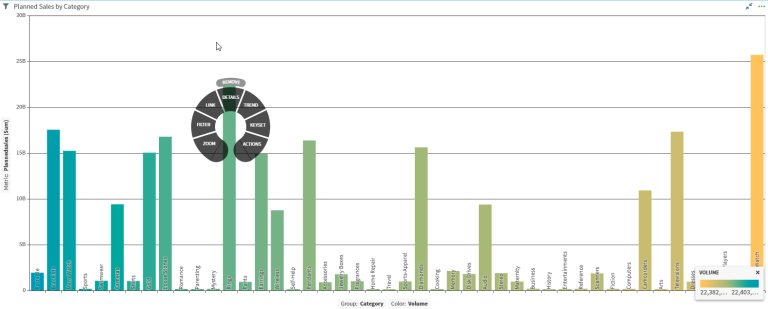
Use the radial menu to explore certain elements of dashboard in greater detail. It allows you to explore and interact with specific data elements.
The radial menu is not available on arc gauges, histograms, KPI charts, maps, or tables of raw data.
To access the radial menu, select a data point in the visual. In the following example of a Real Time Sales bar chart, select one of the vertical bars to display the menu. It is available for each bar in the visual, that is, for each individual data element, and provides the capability to explore or drill into one specific bar of data.
You can rotate the options on the radial menu clockwise (right) and counterclockwise (left) by holding down the shift key and using the left and right arrows on your keyboard.
Controls for these options are provided using the interactivity sidebar. See Control How Users Interact With a Visual.
The following options are available on the radial menu:
- Zoom Option
- Filter Option
- Link Option
- Details Option
- Trend Option
- Keyset Option
- Actions Option
- Remove Option
Zoom Option
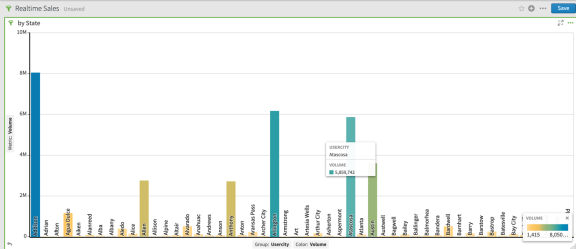
The Zoom menu option allows you to zoom into the selected data point and filter the data for that data point by another filter attribute in the data source. When you select Zoom, a menu appears from which you select the second filter attribute.
For example, if you wanted to see the real time sales for every city in Texas, you would select Texas in the bar chart to bring up the radial menu, select Zoom, and then select the City attribute from the resulting menu. The result set in the bar chart might look like this:
Filter Option
The Filter menu option allows you to filter other visuals in the dashboard that are subscribed to same-source or cross-source links by the data point you have selected. For more information, see Apply a Filter to Dashboard Visuals Using the Radial Menu.
The radial menu can be used to apply cross-visual filters to all visuals in a dashboard. If a visual subscribes to a link field, a radial menu filter for the field from a different visual in the same dashboard will also be applied to the first visual. For example, if Visuals A and B are both subscribed to a link for field Z, and you use the radial menu to apply a filter for field Z on Visual B, the filter will also be applied to Visual A. For information about controlling the publish and subscribe link settings for a visual, see Control How Cross-Visual Filters Interact in a Dashboard and Use Cross-Visual Links for Cross-Visual Filtering.
 Unlike row-level filters, cross-visual filters are not saved with the visual.
In addition, the Filter option on the radial menu is only available when the visual publishes a link for the field it is also using for its visual grouping. It is not available if the published cross-visual links for the visual are muted. See Mute a Published Link.
Link Option
The Link menu option allows you to quickly access a dashboard that has been linked to this visual. This option only appears if a dashboard link has been defined for a visual. See Link a Dashboard.
Details Option
To display additional information about specific data elements, select Details. The details for the element are displayed in a table.
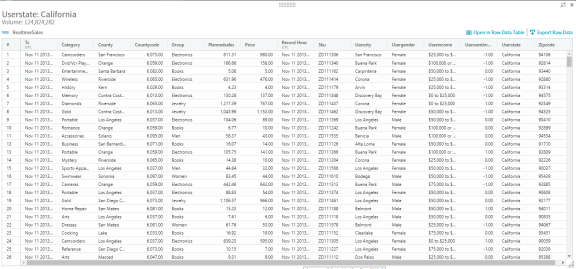
The table header contains the following:
- Attribute whose details you have selected to view
- Metric
- Time attribute and the selected time interval on the time bar
- Volume metric
Select Export Raw Data to export your data set to a CSV file. If the Table visual style is enabled for your data source, you can select Open in Table to view your information.
You can also view the information in a pop-out window over your visual. Select the collapse icon to minimize the window.
Trend Option
The Trend menu option lets you view trends for a selected data point. The Trend menu option is not available for the following visual styles: Line and Bars Trend, Line Trend: Attribute Values, and Line Trend: Multiple Metrics.
Keyset Option
The Keyset menu option lets you create a keyset from the selected data point. See Create a Keyset.
Actions Option
The Actions menu option allows you to invoke an action. If this menu option does not appear on the radial menu, an action template is either not defined or is not enabled for the data source used by the visual.
The invoked action:
- Creates a query definition based on the filters applied to the visual and on the data and limit specifications in the associated action template.
- Sends the query definition to your application. Your application can use the Composer API to run the query and display or use the data that it collects.
You must be logged in as an administrator or as a user with the Can Invoke Actionsprivilege.
To invoke an action, see Invoke an Action.
Remove Option
The Remove menu option lets you exclude the selected data element from your visual. This includes null values.
Comments
0 comments
Please sign in to leave a comment.