
Data Labels (Last Point)

Is there a way to just show The Final Point data label in a line series?
I can do this using an extra series line element with an additional datalayer and setting the width to 0 but my data is very large and want to limit doing this?
-

Since we don't know what type of X-Axis data (number, category, datetime), the easiest way is to make sure your data is sorted so that it matches the X-Axis order, add a sequence column, an aggregate column set to Max, and a calculated column which uses a simple iff statement. Use that calculated column as an @Chart token value for the data point color.
<Report ID="LogiForum.serieslastpoint">
<Body>
<ChartCanvas ID="cc1">
<Series Type="Line" Color="Black" LineThickness="4" ChartXDataColumn="Name" ChartXDataColumnType="DateTime" ChartYDataColumn="Value">
<DataLayer Type="Static">
<StaticDataRow Name="10/1/2020" Value="52000" />
<StaticDataRow Name="11/1/2020" Value="48000" />
<StaticDataRow Name="12/1/2020" Value="35000" />
<StaticDataRow Name="1/1/2021" Value="64052" />
<SequenceColumn ID="seqid" />
<SortFilter SortColumn="seqid" DataType="Number" />
<AggregateColumn AggregateColumn="seqid" AggregateFunction="Max" ID="MaxName" DataType="Date" />
<CalculatedColumn Formula="iif("@Data.seqid~" == "@Data.MaxName~", "#FF0000", "Transparent")" ID="Color" />
</DataLayer>
<MarkerPoints MarkerPointFillColor="@Chart.Color~" MarkerPointRadius="5" />
</Series>
<ChartXAxis>
<AxisLabelStyle Format="Short Date" />
</ChartXAxis>
</ChartCanvas>
</Body>
<ideTestParams />
</Report>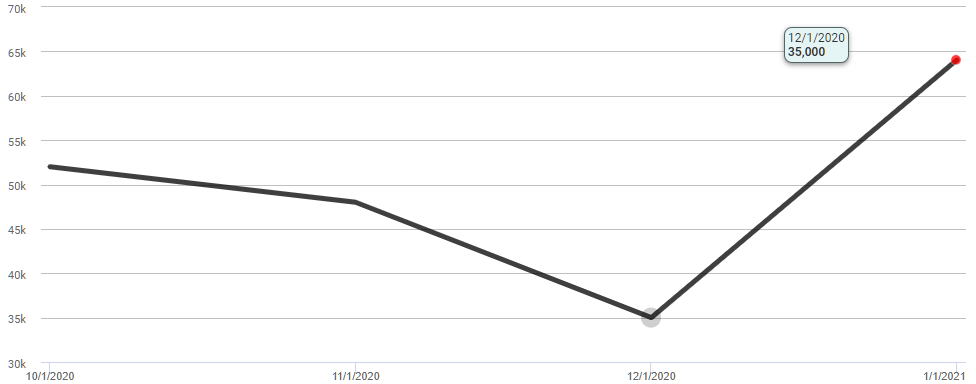 0
0 -
Thank you for this but I want to show the Label so what the value is at the last point - is this possible?
0 -
My apologies for misunderstanding your question. The two-series solution you have would be the easiest method. It does not appear that the Data Label element accepts a tokenized color based on the row of data for the point.
The only other way to achieve this would be to utilize javascript with the beforeCreateChart or afterCreateChart events.
https://devnet.logianalytics.com/hc/en-us/articles/4419715103511-Events-beforeCreateChart-and-afterCreateChart0
Please sign in to leave a comment.
Comments
3 comments