
Dummy row names with value 0.

We are using Logi Version SP-8.
We have a scenario in which we aren't getting data for a particular time frame from database but we want to show them on the visualizations as 0. Please help us in getting a feasible solution for this without using SQL instead adding dummy time frames with 0 values in Logi.
|
-

Hi Aarush,
If you set the X-Axis Type to DateTime, then add a ChartTicksAndGrid element under X-Axis element, you should be able to set the ChartTicksAndGrid "Interval" attribute to "01:00" to see all X-Axis Ticks even if there is no data for that X-Axis value.
You may need to trial and error the Interval (maybe even "1" would work??) value, but that's a Logi hack to get all ticks to show.
Let me know how this goes!
Johnny0 -

Hi Aarush,
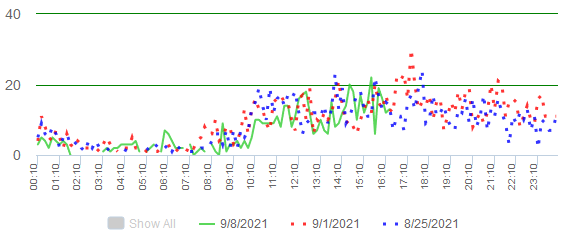
If the above solution does not work I use this often and have achieved it by setting the X-axis Data Column Type to Text. I define the ChartTicksAndGrid as 6 since I am using 10 min time slots.
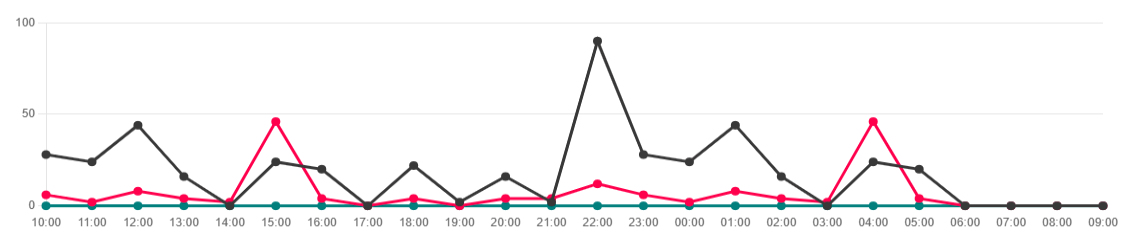
In the following charts I am comparing data by day for a three week period, live data for today solid line, past two week scattered..
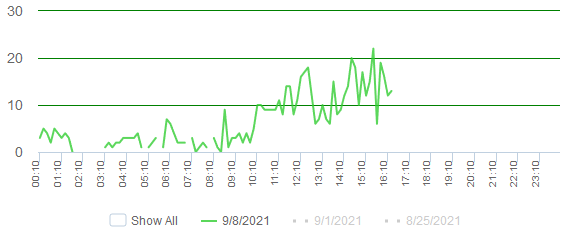
Same chart with the second two weeks deselected.
I hope this helps.
Steve
0
Please sign in to leave a comment.
Comments
2 comments